Immigrants from Cameroon vs Immigrants from Belize In Labor Force | Age > 16
COMPARE
Immigrants from Cameroon
Immigrants from Belize
In Labor Force | Age > 16
In Labor Force | Age > 16 Comparison
Immigrants from Cameroon
Immigrants from Belize
68.7%
IN LABOR FORCE | AGE > 16
100.0/ 100
METRIC RATING
7th/ 347
METRIC RANK
64.7%
IN LABOR FORCE | AGE > 16
9.2/ 100
METRIC RATING
223rd/ 347
METRIC RANK
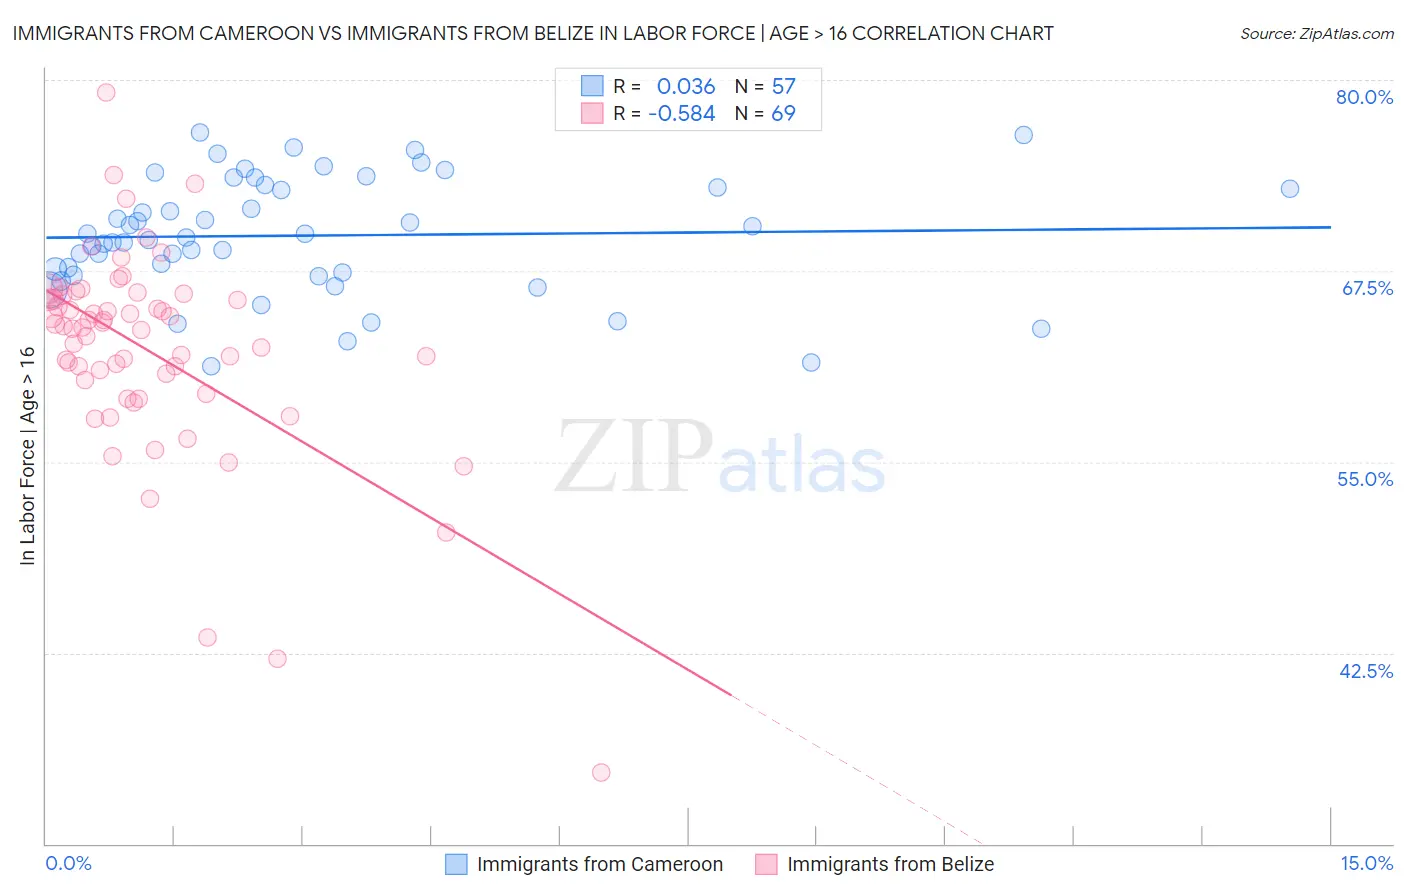
Immigrants from Cameroon vs Immigrants from Belize In Labor Force | Age > 16 Correlation Chart
The statistical analysis conducted on geographies consisting of 130,760,472 people shows no correlation between the proportion of Immigrants from Cameroon and labor force participation rate among population ages 16 and over in the United States with a correlation coefficient (R) of 0.036 and weighted average of 68.7%. Similarly, the statistical analysis conducted on geographies consisting of 130,317,251 people shows a substantial negative correlation between the proportion of Immigrants from Belize and labor force participation rate among population ages 16 and over in the United States with a correlation coefficient (R) of -0.584 and weighted average of 64.7%, a difference of 6.2%.
In Labor Force | Age > 16 Correlation Summary
| Measurement | Immigrants from Cameroon | Immigrants from Belize |
| Minimum | 61.3% | 34.7% |
| Maximum | 76.5% | 79.2% |
| Range | 15.3% | 44.5% |
| Mean | 69.8% | 62.3% |
| Median | 69.7% | 63.8% |
| Interquartile 25% (IQ1) | 67.3% | 59.9% |
| Interquartile 75% (IQ3) | 73.1% | 65.8% |
| Interquartile Range (IQR) | 5.7% | 5.9% |
| Standard Deviation (Sample) | 3.8% | 6.8% |
| Standard Deviation (Population) | 3.8% | 6.8% |
Similar Demographics by In Labor Force | Age > 16
Demographics Similar to Immigrants from Cameroon by In Labor Force | Age > 16
In terms of in labor force | age > 16, the demographic groups most similar to Immigrants from Cameroon are Immigrants from Eritrea (68.9%, a difference of 0.25%), Sierra Leonean (68.9%, a difference of 0.30%), Immigrants from Sierra Leone (68.5%, a difference of 0.32%), Immigrants from Eastern Africa (68.5%, a difference of 0.33%), and Immigrants from Bolivia (68.4%, a difference of 0.36%).
| Demographics | Rating | Rank | In Labor Force | Age > 16 |
| Immigrants | Ethiopia | 100.0 /100 | #1 | Exceptional 69.4% |
| Ethiopians | 100.0 /100 | #2 | Exceptional 69.3% |
| Somalis | 100.0 /100 | #3 | Exceptional 69.2% |
| Immigrants | Somalia | 100.0 /100 | #4 | Exceptional 69.1% |
| Sierra Leoneans | 100.0 /100 | #5 | Exceptional 68.9% |
| Immigrants | Eritrea | 100.0 /100 | #6 | Exceptional 68.9% |
| Immigrants | Cameroon | 100.0 /100 | #7 | Exceptional 68.7% |
| Immigrants | Sierra Leone | 100.0 /100 | #8 | Exceptional 68.5% |
| Immigrants | Eastern Africa | 100.0 /100 | #9 | Exceptional 68.5% |
| Immigrants | Bolivia | 100.0 /100 | #10 | Exceptional 68.4% |
| Bolivians | 100.0 /100 | #11 | Exceptional 68.2% |
| Sudanese | 100.0 /100 | #12 | Exceptional 68.0% |
| Immigrants | Nepal | 100.0 /100 | #13 | Exceptional 68.0% |
| Liberians | 100.0 /100 | #14 | Exceptional 67.8% |
| Immigrants | Middle Africa | 100.0 /100 | #15 | Exceptional 67.7% |
Demographics Similar to Immigrants from Belize by In Labor Force | Age > 16
In terms of in labor force | age > 16, the demographic groups most similar to Immigrants from Belize are Hawaiian (64.7%, a difference of 0.0%), Immigrants from Micronesia (64.7%, a difference of 0.010%), Immigrants from Jamaica (64.7%, a difference of 0.010%), Croatian (64.7%, a difference of 0.010%), and Alaska Native (64.7%, a difference of 0.020%).
| Demographics | Rating | Rank | In Labor Force | Age > 16 |
| Belgians | 11.4 /100 | #216 | Poor 64.7% |
| U.S. Virgin Islanders | 11.3 /100 | #217 | Poor 64.7% |
| Alsatians | 10.7 /100 | #218 | Poor 64.7% |
| Immigrants | Central America | 10.5 /100 | #219 | Poor 64.7% |
| Alaska Natives | 9.9 /100 | #220 | Tragic 64.7% |
| Immigrants | Micronesia | 9.6 /100 | #221 | Tragic 64.7% |
| Hawaiians | 9.3 /100 | #222 | Tragic 64.7% |
| Immigrants | Belize | 9.2 /100 | #223 | Tragic 64.7% |
| Immigrants | Jamaica | 8.8 /100 | #224 | Tragic 64.7% |
| Croatians | 8.8 /100 | #225 | Tragic 64.7% |
| Europeans | 8.3 /100 | #226 | Tragic 64.7% |
| Poles | 8.3 /100 | #227 | Tragic 64.7% |
| Northern Europeans | 8.2 /100 | #228 | Tragic 64.7% |
| British | 7.3 /100 | #229 | Tragic 64.7% |
| Chinese | 7.3 /100 | #230 | Tragic 64.7% |