Scandinavian vs English In Labor Force | Age 20-24
COMPARE
Scandinavian
English
In Labor Force | Age 20-24
In Labor Force | Age 20-24 Comparison
Scandinavians
English
78.5%
IN LABOR FORCE | AGE 20-24
100.0/ 100
METRIC RATING
13th/ 347
METRIC RANK
77.6%
IN LABOR FORCE | AGE 20-24
100.0/ 100
METRIC RATING
32nd/ 347
METRIC RANK
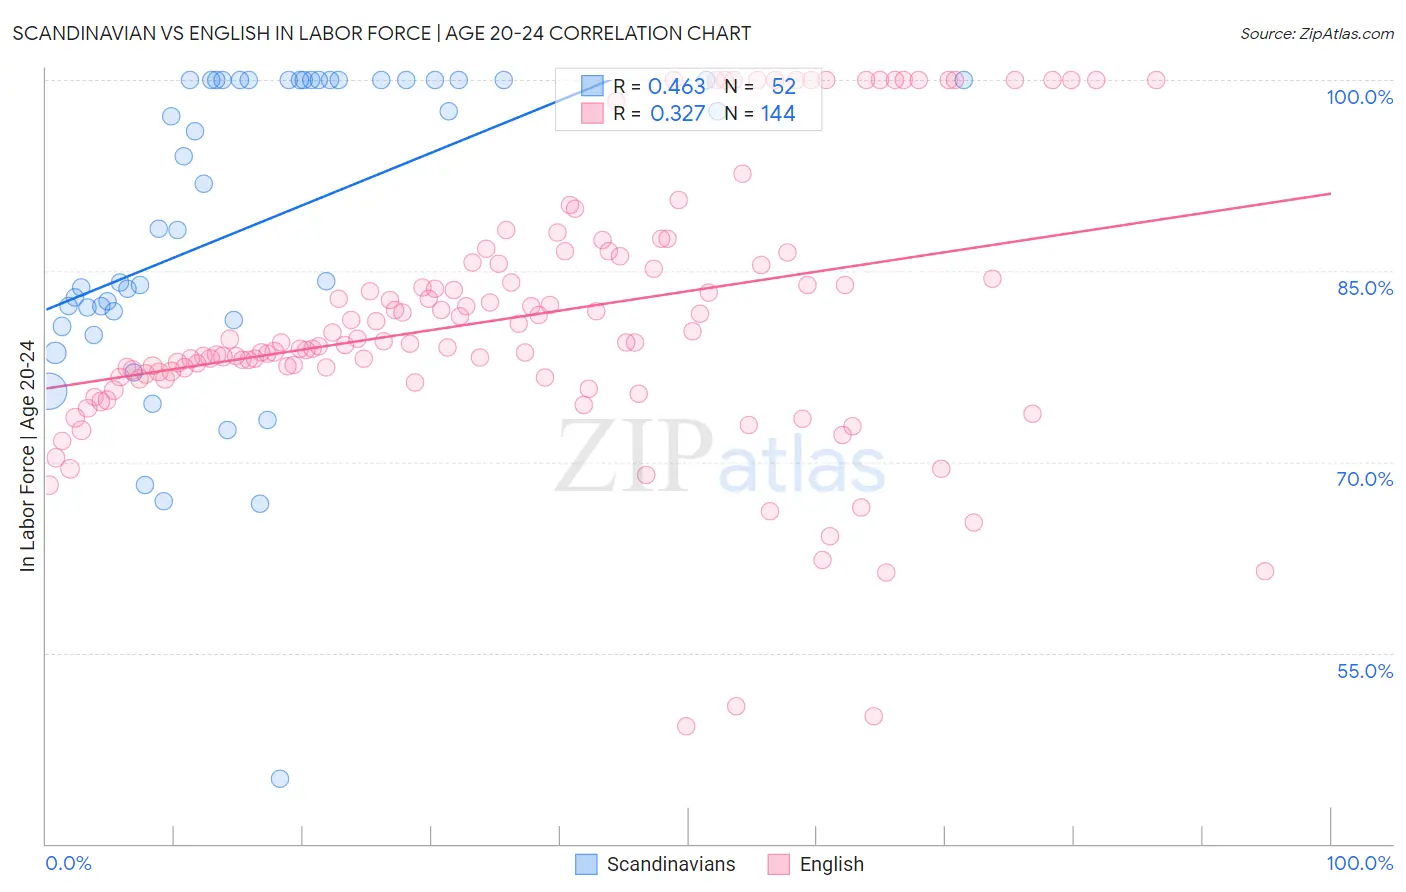
Scandinavian vs English In Labor Force | Age 20-24 Correlation Chart
The statistical analysis conducted on geographies consisting of 472,144,602 people shows a moderate positive correlation between the proportion of Scandinavians and labor force participation rate among population between the ages 20 and 24 in the United States with a correlation coefficient (R) of 0.463 and weighted average of 78.5%. Similarly, the statistical analysis conducted on geographies consisting of 577,480,929 people shows a mild positive correlation between the proportion of English and labor force participation rate among population between the ages 20 and 24 in the United States with a correlation coefficient (R) of 0.327 and weighted average of 77.6%, a difference of 1.3%.
In Labor Force | Age 20-24 Correlation Summary
| Measurement | Scandinavian | English |
| Minimum | 45.1% | 49.2% |
| Maximum | 100.0% | 100.0% |
| Range | 54.9% | 50.8% |
| Mean | 88.5% | 81.4% |
| Median | 90.1% | 79.4% |
| Interquartile 25% (IQ1) | 81.5% | 76.8% |
| Interquartile 75% (IQ3) | 100.0% | 85.9% |
| Interquartile Range (IQR) | 18.5% | 9.1% |
| Standard Deviation (Sample) | 12.4% | 10.5% |
| Standard Deviation (Population) | 12.3% | 10.4% |
Demographics Similar to Scandinavians and English by In Labor Force | Age 20-24
In terms of in labor force | age 20-24, the demographic groups most similar to Scandinavians are Czech (78.5%, a difference of 0.010%), German (78.6%, a difference of 0.070%), Sudanese (78.4%, a difference of 0.14%), Dutch (78.4%, a difference of 0.19%), and Cape Verdean (78.3%, a difference of 0.23%). Similarly, the demographic groups most similar to English are Polish (77.6%, a difference of 0.060%), Swiss (77.7%, a difference of 0.18%), Slovak (77.7%, a difference of 0.20%), Belgian (77.8%, a difference of 0.29%), and Immigrants from Micronesia (77.8%, a difference of 0.33%).
| Demographics | Rating | Rank | In Labor Force | Age 20-24 |
| Germans | 100.0 /100 | #12 | Exceptional 78.6% |
| Scandinavians | 100.0 /100 | #13 | Exceptional 78.5% |
| Czechs | 100.0 /100 | #14 | Exceptional 78.5% |
| Sudanese | 100.0 /100 | #15 | Exceptional 78.4% |
| Dutch | 100.0 /100 | #16 | Exceptional 78.4% |
| Cape Verdeans | 100.0 /100 | #17 | Exceptional 78.3% |
| Immigrants | Bosnia and Herzegovina | 100.0 /100 | #18 | Exceptional 78.1% |
| Bangladeshis | 100.0 /100 | #19 | Exceptional 78.1% |
| French Canadians | 100.0 /100 | #20 | Exceptional 78.1% |
| Puget Sound Salish | 100.0 /100 | #21 | Exceptional 78.0% |
| Pennsylvania Germans | 100.0 /100 | #22 | Exceptional 78.0% |
| Yugoslavians | 100.0 /100 | #23 | Exceptional 78.0% |
| Liberians | 100.0 /100 | #24 | Exceptional 78.0% |
| Tlingit-Haida | 100.0 /100 | #25 | Exceptional 77.9% |
| Tongans | 100.0 /100 | #26 | Exceptional 77.9% |
| Immigrants | Micronesia | 100.0 /100 | #27 | Exceptional 77.8% |
| Belgians | 100.0 /100 | #28 | Exceptional 77.8% |
| Slovaks | 100.0 /100 | #29 | Exceptional 77.7% |
| Swiss | 100.0 /100 | #30 | Exceptional 77.7% |
| Poles | 100.0 /100 | #31 | Exceptional 77.6% |
| English | 100.0 /100 | #32 | Exceptional 77.6% |