Scandinavian vs Ukrainian In Labor Force | Age 20-24
COMPARE
Scandinavian
Ukrainian
In Labor Force | Age 20-24
In Labor Force | Age 20-24 Comparison
Scandinavians
Ukrainians
78.5%
IN LABOR FORCE | AGE 20-24
100.0/ 100
METRIC RATING
13th/ 347
METRIC RANK
75.9%
IN LABOR FORCE | AGE 20-24
95.7/ 100
METRIC RATING
111th/ 347
METRIC RANK
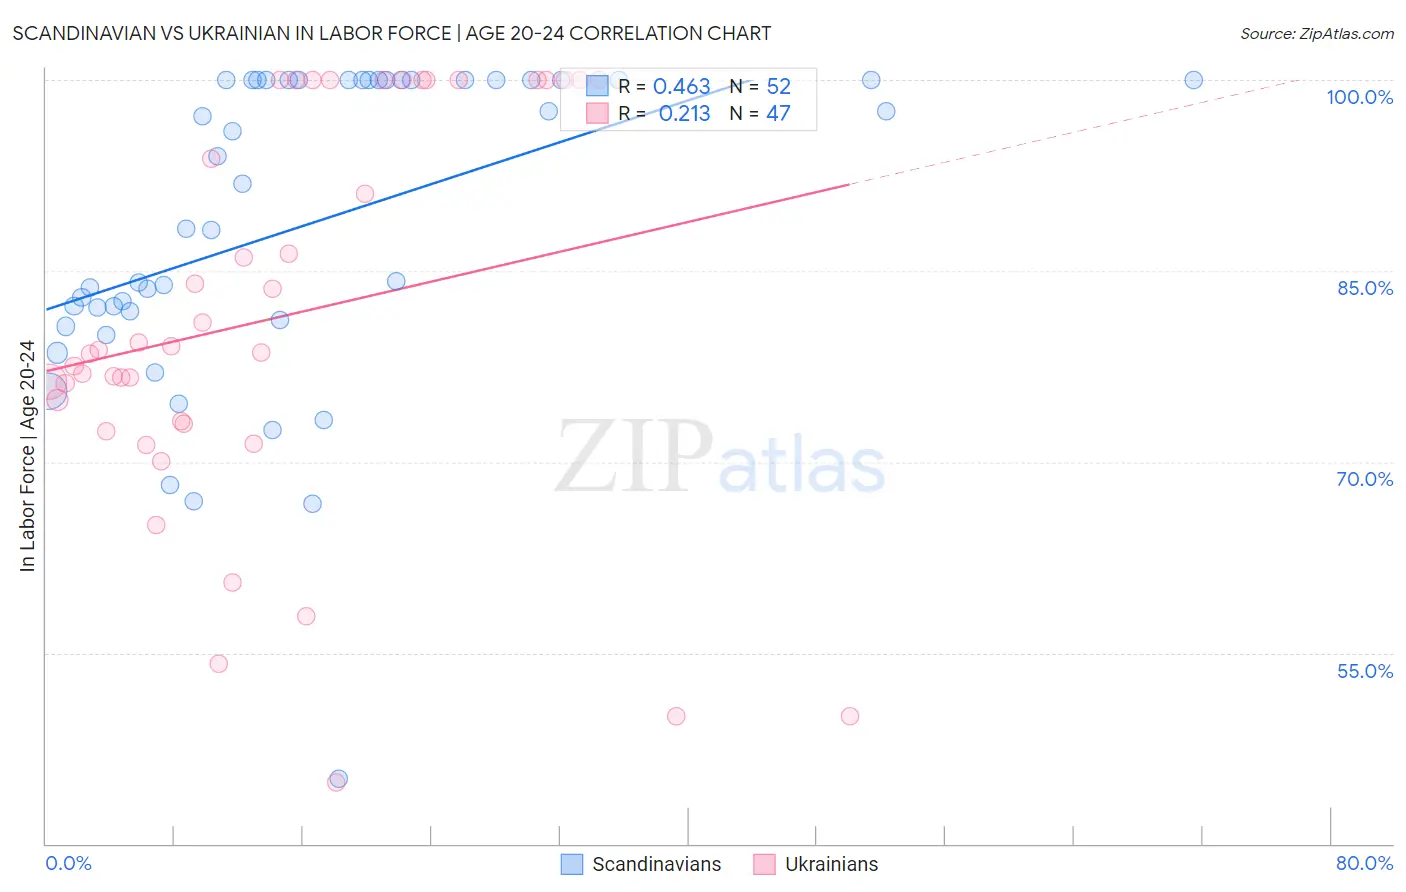
Scandinavian vs Ukrainian In Labor Force | Age 20-24 Correlation Chart
The statistical analysis conducted on geographies consisting of 472,144,602 people shows a moderate positive correlation between the proportion of Scandinavians and labor force participation rate among population between the ages 20 and 24 in the United States with a correlation coefficient (R) of 0.463 and weighted average of 78.5%. Similarly, the statistical analysis conducted on geographies consisting of 448,349,604 people shows a weak positive correlation between the proportion of Ukrainians and labor force participation rate among population between the ages 20 and 24 in the United States with a correlation coefficient (R) of 0.213 and weighted average of 75.9%, a difference of 3.5%.
In Labor Force | Age 20-24 Correlation Summary
| Measurement | Scandinavian | Ukrainian |
| Minimum | 45.1% | 44.8% |
| Maximum | 100.0% | 100.0% |
| Range | 54.9% | 55.2% |
| Mean | 88.5% | 81.4% |
| Median | 90.1% | 78.8% |
| Interquartile 25% (IQ1) | 81.5% | 73.0% |
| Interquartile 75% (IQ3) | 100.0% | 100.0% |
| Interquartile Range (IQR) | 18.5% | 27.0% |
| Standard Deviation (Sample) | 12.4% | 15.6% |
| Standard Deviation (Population) | 12.3% | 15.5% |
Similar Demographics by In Labor Force | Age 20-24
Demographics Similar to Scandinavians by In Labor Force | Age 20-24
In terms of in labor force | age 20-24, the demographic groups most similar to Scandinavians are Czech (78.5%, a difference of 0.010%), German (78.6%, a difference of 0.070%), Sudanese (78.4%, a difference of 0.14%), Finnish (78.7%, a difference of 0.18%), and Dutch (78.4%, a difference of 0.19%).
| Demographics | Rating | Rank | In Labor Force | Age 20-24 |
| Danes | 100.0 /100 | #6 | Exceptional 79.0% |
| Luxembourgers | 100.0 /100 | #7 | Exceptional 79.0% |
| Immigrants | Cabo Verde | 100.0 /100 | #8 | Exceptional 78.9% |
| Swedes | 100.0 /100 | #9 | Exceptional 78.8% |
| Slovenes | 100.0 /100 | #10 | Exceptional 78.7% |
| Finns | 100.0 /100 | #11 | Exceptional 78.7% |
| Germans | 100.0 /100 | #12 | Exceptional 78.6% |
| Scandinavians | 100.0 /100 | #13 | Exceptional 78.5% |
| Czechs | 100.0 /100 | #14 | Exceptional 78.5% |
| Sudanese | 100.0 /100 | #15 | Exceptional 78.4% |
| Dutch | 100.0 /100 | #16 | Exceptional 78.4% |
| Cape Verdeans | 100.0 /100 | #17 | Exceptional 78.3% |
| Immigrants | Bosnia and Herzegovina | 100.0 /100 | #18 | Exceptional 78.1% |
| Bangladeshis | 100.0 /100 | #19 | Exceptional 78.1% |
| French Canadians | 100.0 /100 | #20 | Exceptional 78.1% |
Demographics Similar to Ukrainians by In Labor Force | Age 20-24
In terms of in labor force | age 20-24, the demographic groups most similar to Ukrainians are Cherokee (75.9%, a difference of 0.010%), Immigrants from Morocco (75.9%, a difference of 0.010%), Immigrants from Canada (75.9%, a difference of 0.010%), Immigrants from Netherlands (75.9%, a difference of 0.040%), and Immigrants from Zimbabwe (75.9%, a difference of 0.050%).
| Demographics | Rating | Rank | In Labor Force | Age 20-24 |
| Macedonians | 97.2 /100 | #104 | Exceptional 76.0% |
| Immigrants | Nepal | 97.2 /100 | #105 | Exceptional 76.0% |
| Immigrants | Uganda | 97.1 /100 | #106 | Exceptional 76.0% |
| Greeks | 96.9 /100 | #107 | Exceptional 76.0% |
| Iraqis | 96.6 /100 | #108 | Exceptional 76.0% |
| Cherokee | 95.8 /100 | #109 | Exceptional 75.9% |
| Immigrants | Morocco | 95.8 /100 | #110 | Exceptional 75.9% |
| Ukrainians | 95.7 /100 | #111 | Exceptional 75.9% |
| Immigrants | Canada | 95.6 /100 | #112 | Exceptional 75.9% |
| Immigrants | Netherlands | 95.3 /100 | #113 | Exceptional 75.9% |
| Immigrants | Zimbabwe | 95.1 /100 | #114 | Exceptional 75.9% |
| Alaska Natives | 95.1 /100 | #115 | Exceptional 75.9% |
| Immigrants | North America | 95.0 /100 | #116 | Exceptional 75.9% |
| Assyrians/Chaldeans/Syriacs | 94.9 /100 | #117 | Exceptional 75.9% |
| Spanish Americans | 94.8 /100 | #118 | Exceptional 75.8% |