Scandinavian vs Immigrants from North Macedonia In Labor Force | Age 20-24
COMPARE
Scandinavian
Immigrants from North Macedonia
In Labor Force | Age 20-24
In Labor Force | Age 20-24 Comparison
Scandinavians
Immigrants from North Macedonia
78.5%
IN LABOR FORCE | AGE 20-24
100.0/ 100
METRIC RATING
13th/ 347
METRIC RANK
76.1%
IN LABOR FORCE | AGE 20-24
97.5/ 100
METRIC RATING
103rd/ 347
METRIC RANK
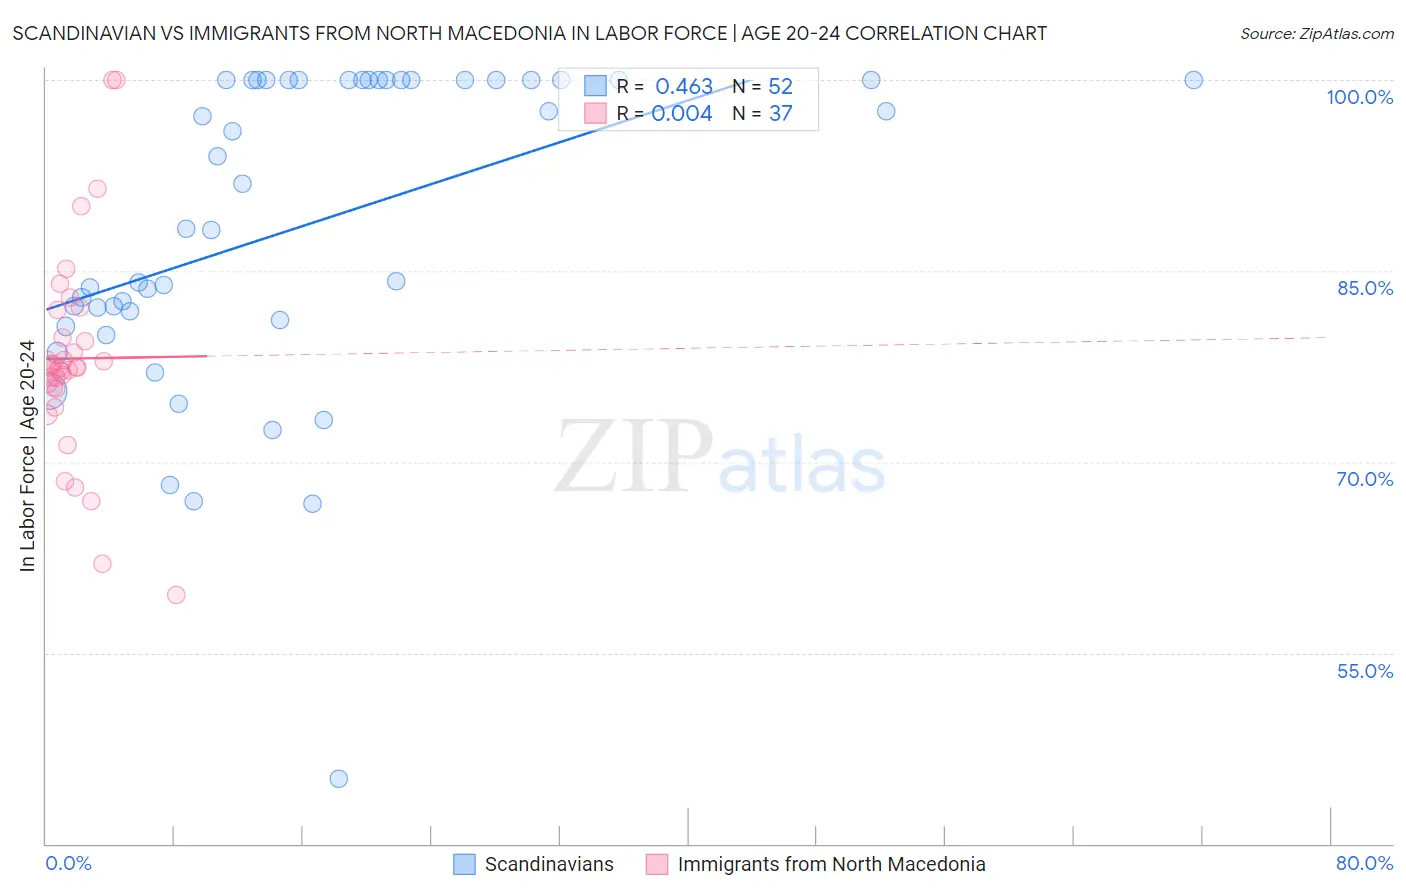
Scandinavian vs Immigrants from North Macedonia In Labor Force | Age 20-24 Correlation Chart
The statistical analysis conducted on geographies consisting of 472,144,602 people shows a moderate positive correlation between the proportion of Scandinavians and labor force participation rate among population between the ages 20 and 24 in the United States with a correlation coefficient (R) of 0.463 and weighted average of 78.5%. Similarly, the statistical analysis conducted on geographies consisting of 74,315,577 people shows no correlation between the proportion of Immigrants from North Macedonia and labor force participation rate among population between the ages 20 and 24 in the United States with a correlation coefficient (R) of 0.004 and weighted average of 76.1%, a difference of 3.3%.
In Labor Force | Age 20-24 Correlation Summary
| Measurement | Scandinavian | Immigrants from North Macedonia |
| Minimum | 45.1% | 59.5% |
| Maximum | 100.0% | 100.0% |
| Range | 54.9% | 40.5% |
| Mean | 88.5% | 78.1% |
| Median | 90.1% | 77.4% |
| Interquartile 25% (IQ1) | 81.5% | 75.8% |
| Interquartile 75% (IQ3) | 100.0% | 80.8% |
| Interquartile Range (IQR) | 18.5% | 5.0% |
| Standard Deviation (Sample) | 12.4% | 8.3% |
| Standard Deviation (Population) | 12.3% | 8.1% |
Similar Demographics by In Labor Force | Age 20-24
Demographics Similar to Scandinavians by In Labor Force | Age 20-24
In terms of in labor force | age 20-24, the demographic groups most similar to Scandinavians are Czech (78.5%, a difference of 0.010%), German (78.6%, a difference of 0.070%), Sudanese (78.4%, a difference of 0.14%), Finnish (78.7%, a difference of 0.18%), and Dutch (78.4%, a difference of 0.19%).
| Demographics | Rating | Rank | In Labor Force | Age 20-24 |
| Danes | 100.0 /100 | #6 | Exceptional 79.0% |
| Luxembourgers | 100.0 /100 | #7 | Exceptional 79.0% |
| Immigrants | Cabo Verde | 100.0 /100 | #8 | Exceptional 78.9% |
| Swedes | 100.0 /100 | #9 | Exceptional 78.8% |
| Slovenes | 100.0 /100 | #10 | Exceptional 78.7% |
| Finns | 100.0 /100 | #11 | Exceptional 78.7% |
| Germans | 100.0 /100 | #12 | Exceptional 78.6% |
| Scandinavians | 100.0 /100 | #13 | Exceptional 78.5% |
| Czechs | 100.0 /100 | #14 | Exceptional 78.5% |
| Sudanese | 100.0 /100 | #15 | Exceptional 78.4% |
| Dutch | 100.0 /100 | #16 | Exceptional 78.4% |
| Cape Verdeans | 100.0 /100 | #17 | Exceptional 78.3% |
| Immigrants | Bosnia and Herzegovina | 100.0 /100 | #18 | Exceptional 78.1% |
| Bangladeshis | 100.0 /100 | #19 | Exceptional 78.1% |
| French Canadians | 100.0 /100 | #20 | Exceptional 78.1% |
Demographics Similar to Immigrants from North Macedonia by In Labor Force | Age 20-24
In terms of in labor force | age 20-24, the demographic groups most similar to Immigrants from North Macedonia are Latvian (76.1%, a difference of 0.020%), Immigrants from Poland (76.1%, a difference of 0.030%), Shoshone (76.1%, a difference of 0.040%), Macedonian (76.0%, a difference of 0.040%), and Immigrants from Nepal (76.0%, a difference of 0.040%).
| Demographics | Rating | Rank | In Labor Force | Age 20-24 |
| Immigrants | Nonimmigrants | 98.5 /100 | #96 | Exceptional 76.2% |
| Immigrants | Lithuania | 98.0 /100 | #97 | Exceptional 76.1% |
| Immigrants | Oceania | 98.0 /100 | #98 | Exceptional 76.1% |
| Americans | 97.8 /100 | #99 | Exceptional 76.1% |
| Shoshone | 97.8 /100 | #100 | Exceptional 76.1% |
| Immigrants | Poland | 97.7 /100 | #101 | Exceptional 76.1% |
| Latvians | 97.6 /100 | #102 | Exceptional 76.1% |
| Immigrants | North Macedonia | 97.5 /100 | #103 | Exceptional 76.1% |
| Macedonians | 97.2 /100 | #104 | Exceptional 76.0% |
| Immigrants | Nepal | 97.2 /100 | #105 | Exceptional 76.0% |
| Immigrants | Uganda | 97.1 /100 | #106 | Exceptional 76.0% |
| Greeks | 96.9 /100 | #107 | Exceptional 76.0% |
| Iraqis | 96.6 /100 | #108 | Exceptional 76.0% |
| Cherokee | 95.8 /100 | #109 | Exceptional 75.9% |
| Immigrants | Morocco | 95.8 /100 | #110 | Exceptional 75.9% |