Hopi vs English In Labor Force | Age 20-24
COMPARE
Hopi
English
In Labor Force | Age 20-24
In Labor Force | Age 20-24 Comparison
Hopi
English
66.0%
IN LABOR FORCE | AGE 20-24
0.0/ 100
METRIC RATING
345th/ 347
METRIC RANK
77.6%
IN LABOR FORCE | AGE 20-24
100.0/ 100
METRIC RATING
32nd/ 347
METRIC RANK
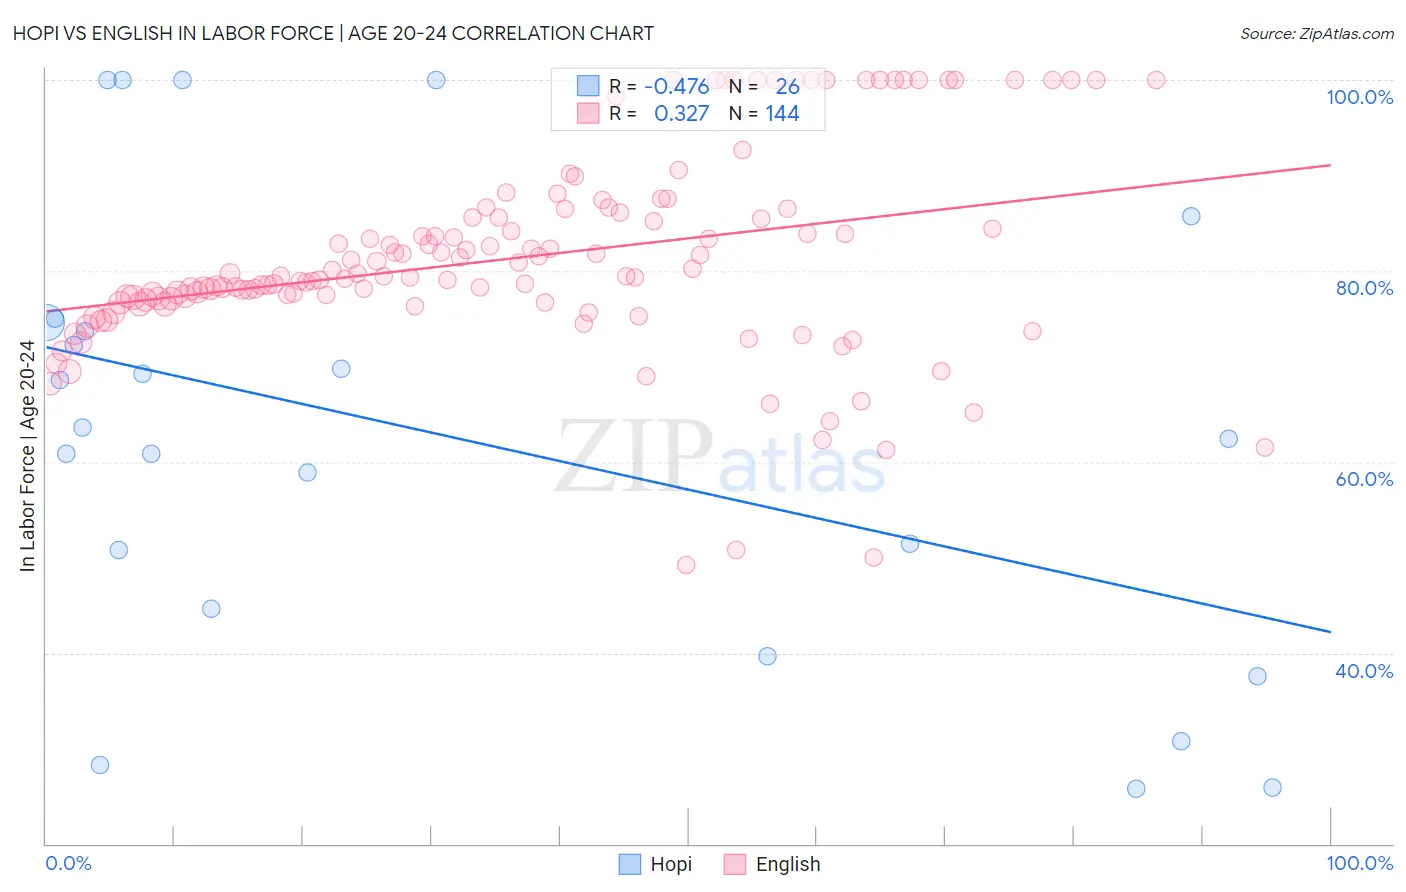
Hopi vs English In Labor Force | Age 20-24 Correlation Chart
The statistical analysis conducted on geographies consisting of 74,726,569 people shows a moderate negative correlation between the proportion of Hopi and labor force participation rate among population between the ages 20 and 24 in the United States with a correlation coefficient (R) of -0.476 and weighted average of 66.0%. Similarly, the statistical analysis conducted on geographies consisting of 577,480,929 people shows a mild positive correlation between the proportion of English and labor force participation rate among population between the ages 20 and 24 in the United States with a correlation coefficient (R) of 0.327 and weighted average of 77.6%, a difference of 17.4%.
In Labor Force | Age 20-24 Correlation Summary
| Measurement | Hopi | English |
| Minimum | 25.7% | 49.2% |
| Maximum | 100.0% | 100.0% |
| Range | 74.3% | 50.8% |
| Mean | 62.7% | 81.4% |
| Median | 63.0% | 79.4% |
| Interquartile 25% (IQ1) | 44.6% | 76.8% |
| Interquartile 75% (IQ3) | 74.6% | 85.9% |
| Interquartile Range (IQR) | 30.0% | 9.1% |
| Standard Deviation (Sample) | 23.2% | 10.5% |
| Standard Deviation (Population) | 22.7% | 10.4% |
Similar Demographics by In Labor Force | Age 20-24
Demographics Similar to Hopi by In Labor Force | Age 20-24
In terms of in labor force | age 20-24, the demographic groups most similar to Hopi are Lumbee (65.5%, a difference of 0.79%), Immigrants from Grenada (67.2%, a difference of 1.7%), Navajo (64.8%, a difference of 1.8%), Puerto Rican (68.3%, a difference of 3.5%), and Immigrants from St. Vincent and the Grenadines (68.4%, a difference of 3.6%).
| Demographics | Rating | Rank | In Labor Force | Age 20-24 |
| Yuman | 0.0 /100 | #333 | Tragic 70.3% |
| British West Indians | 0.0 /100 | #334 | Tragic 70.0% |
| Immigrants | Barbados | 0.0 /100 | #335 | Tragic 69.7% |
| Immigrants | Guyana | 0.0 /100 | #336 | Tragic 69.3% |
| Guyanese | 0.0 /100 | #337 | Tragic 69.2% |
| Pima | 0.0 /100 | #338 | Tragic 69.0% |
| Immigrants | Yemen | 0.0 /100 | #339 | Tragic 68.9% |
| Menominee | 0.0 /100 | #340 | Tragic 68.7% |
| Tohono O'odham | 0.0 /100 | #341 | Tragic 68.6% |
| Immigrants | St. Vincent and the Grenadines | 0.0 /100 | #342 | Tragic 68.4% |
| Puerto Ricans | 0.0 /100 | #343 | Tragic 68.3% |
| Immigrants | Grenada | 0.0 /100 | #344 | Tragic 67.2% |
| Hopi | 0.0 /100 | #345 | Tragic 66.0% |
| Lumbee | 0.0 /100 | #346 | Tragic 65.5% |
| Navajo | 0.0 /100 | #347 | Tragic 64.8% |
Demographics Similar to English by In Labor Force | Age 20-24
In terms of in labor force | age 20-24, the demographic groups most similar to English are Immigrants from Ethiopia (77.5%, a difference of 0.050%), German Russian (77.5%, a difference of 0.050%), Polish (77.6%, a difference of 0.060%), Immigrants from Eastern Africa (77.5%, a difference of 0.070%), and Welsh (77.5%, a difference of 0.090%).
| Demographics | Rating | Rank | In Labor Force | Age 20-24 |
| Tlingit-Haida | 100.0 /100 | #25 | Exceptional 77.9% |
| Tongans | 100.0 /100 | #26 | Exceptional 77.9% |
| Immigrants | Micronesia | 100.0 /100 | #27 | Exceptional 77.8% |
| Belgians | 100.0 /100 | #28 | Exceptional 77.8% |
| Slovaks | 100.0 /100 | #29 | Exceptional 77.7% |
| Swiss | 100.0 /100 | #30 | Exceptional 77.7% |
| Poles | 100.0 /100 | #31 | Exceptional 77.6% |
| English | 100.0 /100 | #32 | Exceptional 77.6% |
| Immigrants | Ethiopia | 100.0 /100 | #33 | Exceptional 77.5% |
| German Russians | 100.0 /100 | #34 | Exceptional 77.5% |
| Immigrants | Eastern Africa | 100.0 /100 | #35 | Exceptional 77.5% |
| Welsh | 100.0 /100 | #36 | Exceptional 77.5% |
| Czechoslovakians | 100.0 /100 | #37 | Exceptional 77.5% |
| Marshallese | 100.0 /100 | #38 | Exceptional 77.4% |
| Irish | 100.0 /100 | #39 | Exceptional 77.4% |