Scandinavian vs Colombian In Labor Force | Age 20-24
COMPARE
Scandinavian
Colombian
In Labor Force | Age 20-24
In Labor Force | Age 20-24 Comparison
Scandinavians
Colombians
78.5%
IN LABOR FORCE | AGE 20-24
100.0/ 100
METRIC RATING
13th/ 347
METRIC RANK
73.5%
IN LABOR FORCE | AGE 20-24
0.3/ 100
METRIC RATING
269th/ 347
METRIC RANK
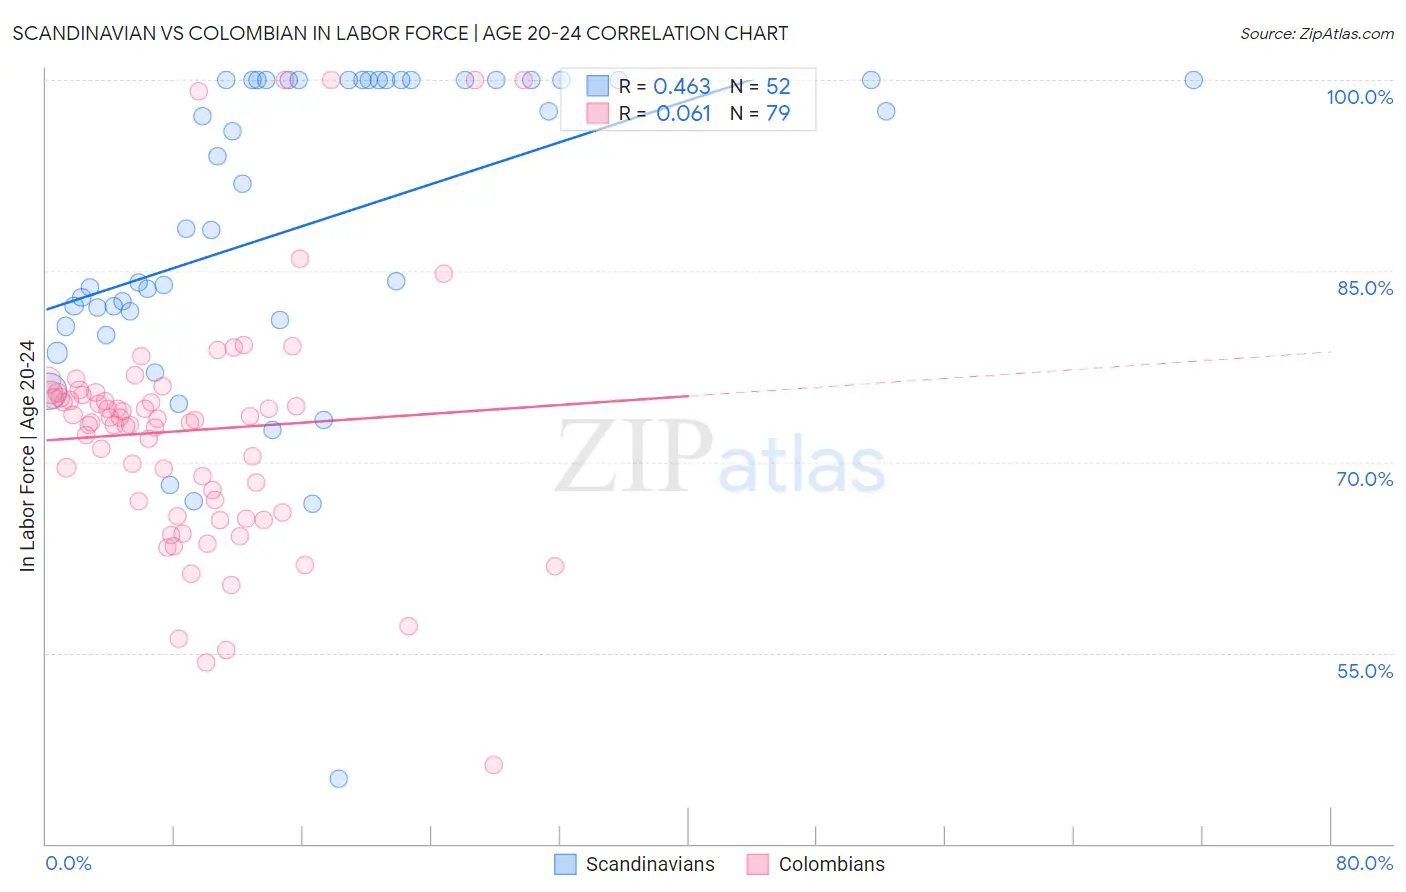
Scandinavian vs Colombian In Labor Force | Age 20-24 Correlation Chart
The statistical analysis conducted on geographies consisting of 472,144,602 people shows a moderate positive correlation between the proportion of Scandinavians and labor force participation rate among population between the ages 20 and 24 in the United States with a correlation coefficient (R) of 0.463 and weighted average of 78.5%. Similarly, the statistical analysis conducted on geographies consisting of 419,536,889 people shows a slight positive correlation between the proportion of Colombians and labor force participation rate among population between the ages 20 and 24 in the United States with a correlation coefficient (R) of 0.061 and weighted average of 73.5%, a difference of 6.9%.
In Labor Force | Age 20-24 Correlation Summary
| Measurement | Scandinavian | Colombian |
| Minimum | 45.1% | 46.2% |
| Maximum | 100.0% | 100.0% |
| Range | 54.9% | 53.8% |
| Mean | 88.5% | 72.5% |
| Median | 90.1% | 73.3% |
| Interquartile 25% (IQ1) | 81.5% | 66.0% |
| Interquartile 75% (IQ3) | 100.0% | 75.4% |
| Interquartile Range (IQR) | 18.5% | 9.4% |
| Standard Deviation (Sample) | 12.4% | 9.9% |
| Standard Deviation (Population) | 12.3% | 9.8% |
Similar Demographics by In Labor Force | Age 20-24
Demographics Similar to Scandinavians by In Labor Force | Age 20-24
In terms of in labor force | age 20-24, the demographic groups most similar to Scandinavians are Czech (78.5%, a difference of 0.010%), German (78.6%, a difference of 0.070%), Sudanese (78.4%, a difference of 0.14%), Finnish (78.7%, a difference of 0.18%), and Dutch (78.4%, a difference of 0.19%).
| Demographics | Rating | Rank | In Labor Force | Age 20-24 |
| Danes | 100.0 /100 | #6 | Exceptional 79.0% |
| Luxembourgers | 100.0 /100 | #7 | Exceptional 79.0% |
| Immigrants | Cabo Verde | 100.0 /100 | #8 | Exceptional 78.9% |
| Swedes | 100.0 /100 | #9 | Exceptional 78.8% |
| Slovenes | 100.0 /100 | #10 | Exceptional 78.7% |
| Finns | 100.0 /100 | #11 | Exceptional 78.7% |
| Germans | 100.0 /100 | #12 | Exceptional 78.6% |
| Scandinavians | 100.0 /100 | #13 | Exceptional 78.5% |
| Czechs | 100.0 /100 | #14 | Exceptional 78.5% |
| Sudanese | 100.0 /100 | #15 | Exceptional 78.4% |
| Dutch | 100.0 /100 | #16 | Exceptional 78.4% |
| Cape Verdeans | 100.0 /100 | #17 | Exceptional 78.3% |
| Immigrants | Bosnia and Herzegovina | 100.0 /100 | #18 | Exceptional 78.1% |
| Bangladeshis | 100.0 /100 | #19 | Exceptional 78.1% |
| French Canadians | 100.0 /100 | #20 | Exceptional 78.1% |
Demographics Similar to Colombians by In Labor Force | Age 20-24
In terms of in labor force | age 20-24, the demographic groups most similar to Colombians are South American (73.5%, a difference of 0.030%), Immigrants from Russia (73.5%, a difference of 0.030%), Immigrants from Western Asia (73.5%, a difference of 0.080%), Immigrants from Indonesia (73.4%, a difference of 0.090%), and Belizean (73.4%, a difference of 0.10%).
| Demographics | Rating | Rank | In Labor Force | Age 20-24 |
| Asians | 0.6 /100 | #262 | Tragic 73.7% |
| Immigrants | Asia | 0.5 /100 | #263 | Tragic 73.6% |
| Immigrants | Haiti | 0.5 /100 | #264 | Tragic 73.6% |
| Burmese | 0.5 /100 | #265 | Tragic 73.6% |
| Haitians | 0.5 /100 | #266 | Tragic 73.6% |
| Immigrants | Western Asia | 0.4 /100 | #267 | Tragic 73.5% |
| South Americans | 0.4 /100 | #268 | Tragic 73.5% |
| Colombians | 0.3 /100 | #269 | Tragic 73.5% |
| Immigrants | Russia | 0.3 /100 | #270 | Tragic 73.5% |
| Immigrants | Indonesia | 0.3 /100 | #271 | Tragic 73.4% |
| Belizeans | 0.3 /100 | #272 | Tragic 73.4% |
| Cheyenne | 0.2 /100 | #273 | Tragic 73.4% |
| Immigrants | Colombia | 0.2 /100 | #274 | Tragic 73.4% |
| Immigrants | South America | 0.2 /100 | #275 | Tragic 73.3% |
| Mongolians | 0.2 /100 | #276 | Tragic 73.3% |