Scandinavian vs English Child Poverty Under the Age of 16
COMPARE
Scandinavian
English
Child Poverty Under the Age of 16
Child Poverty Under the Age of 16 Comparison
Scandinavians
English
14.1%
CHILD POVERTY UNDER THE AGE OF 16
98.6/ 100
METRIC RATING
59th/ 347
METRIC RANK
14.9%
CHILD POVERTY UNDER THE AGE OF 16
93.5/ 100
METRIC RATING
110th/ 347
METRIC RANK
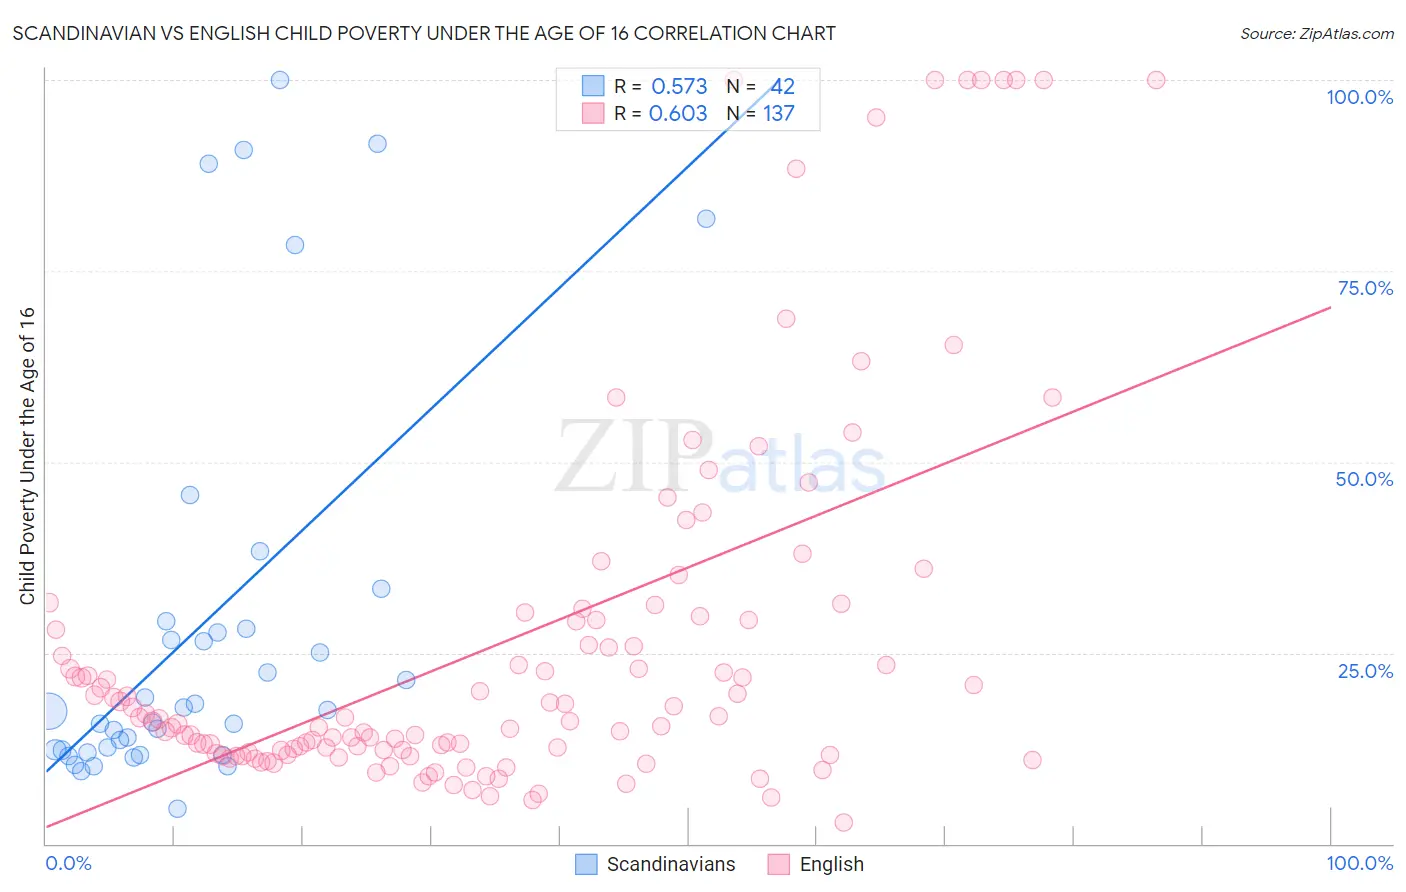
Scandinavian vs English Child Poverty Under the Age of 16 Correlation Chart
The statistical analysis conducted on geographies consisting of 465,879,873 people shows a substantial positive correlation between the proportion of Scandinavians and poverty level among children under the age of 16 in the United States with a correlation coefficient (R) of 0.573 and weighted average of 14.1%. Similarly, the statistical analysis conducted on geographies consisting of 565,080,494 people shows a significant positive correlation between the proportion of English and poverty level among children under the age of 16 in the United States with a correlation coefficient (R) of 0.603 and weighted average of 14.9%, a difference of 5.5%.
Child Poverty Under the Age of 16 Correlation Summary
| Measurement | Scandinavian | English |
| Minimum | 4.7% | 2.8% |
| Maximum | 100.0% | 100.0% |
| Range | 95.3% | 97.2% |
| Mean | 28.4% | 26.1% |
| Median | 17.4% | 16.3% |
| Interquartile 25% (IQ1) | 12.2% | 11.9% |
| Interquartile 75% (IQ3) | 28.2% | 29.3% |
| Interquartile Range (IQR) | 16.0% | 17.3% |
| Standard Deviation (Sample) | 26.4% | 24.2% |
| Standard Deviation (Population) | 26.0% | 24.1% |
Similar Demographics by Child Poverty Under the Age of 16
Demographics Similar to Scandinavians by Child Poverty Under the Age of 16
In terms of child poverty under the age of 16, the demographic groups most similar to Scandinavians are Immigrants from Pakistan (14.1%, a difference of 0.010%), Immigrants from Belgium (14.1%, a difference of 0.030%), Immigrants from Serbia (14.1%, a difference of 0.12%), Immigrants from Austria (14.2%, a difference of 0.19%), and Immigrants from Sweden (14.2%, a difference of 0.22%).
| Demographics | Rating | Rank | Child Poverty Under the Age of 16 |
| Poles | 98.9 /100 | #52 | Exceptional 14.0% |
| Immigrants | Israel | 98.8 /100 | #53 | Exceptional 14.1% |
| Tsimshian | 98.8 /100 | #54 | Exceptional 14.1% |
| Immigrants | Indonesia | 98.7 /100 | #55 | Exceptional 14.1% |
| Immigrants | Serbia | 98.7 /100 | #56 | Exceptional 14.1% |
| Immigrants | Belgium | 98.6 /100 | #57 | Exceptional 14.1% |
| Immigrants | Pakistan | 98.6 /100 | #58 | Exceptional 14.1% |
| Scandinavians | 98.6 /100 | #59 | Exceptional 14.1% |
| Immigrants | Austria | 98.5 /100 | #60 | Exceptional 14.2% |
| Immigrants | Sweden | 98.5 /100 | #61 | Exceptional 14.2% |
| Zimbabweans | 98.5 /100 | #62 | Exceptional 14.2% |
| Immigrants | Europe | 98.4 /100 | #63 | Exceptional 14.2% |
| Immigrants | Romania | 98.3 /100 | #64 | Exceptional 14.2% |
| Immigrants | Philippines | 98.2 /100 | #65 | Exceptional 14.3% |
| Slovenes | 98.1 /100 | #66 | Exceptional 14.3% |
Demographics Similar to English by Child Poverty Under the Age of 16
In terms of child poverty under the age of 16, the demographic groups most similar to English are Immigrants from Denmark (14.9%, a difference of 0.010%), Irish (14.9%, a difference of 0.070%), Belgian (14.9%, a difference of 0.11%), Sri Lankan (14.9%, a difference of 0.14%), and Immigrants from Ukraine (14.9%, a difference of 0.20%).
| Demographics | Rating | Rank | Child Poverty Under the Age of 16 |
| Immigrants | Egypt | 94.9 /100 | #103 | Exceptional 14.8% |
| Immigrants | England | 94.8 /100 | #104 | Exceptional 14.8% |
| Basques | 94.7 /100 | #105 | Exceptional 14.8% |
| Serbians | 94.5 /100 | #106 | Exceptional 14.8% |
| Chileans | 94.4 /100 | #107 | Exceptional 14.8% |
| Jordanians | 94.2 /100 | #108 | Exceptional 14.8% |
| Tlingit-Haida | 94.1 /100 | #109 | Exceptional 14.9% |
| English | 93.5 /100 | #110 | Exceptional 14.9% |
| Immigrants | Denmark | 93.5 /100 | #111 | Exceptional 14.9% |
| Irish | 93.4 /100 | #112 | Exceptional 14.9% |
| Belgians | 93.3 /100 | #113 | Exceptional 14.9% |
| Sri Lankans | 93.2 /100 | #114 | Exceptional 14.9% |
| Immigrants | Ukraine | 93.1 /100 | #115 | Exceptional 14.9% |
| Carpatho Rusyns | 93.1 /100 | #116 | Exceptional 14.9% |
| Immigrants | Norway | 92.8 /100 | #117 | Exceptional 15.0% |