Salvadoran vs Immigrants from Kazakhstan In Labor Force | Age 35-44

COMPARE

Salvadoran
Race
Ancestry
AfghanAfricanAlaska NativeAlaskan AthabascanAlbanianAleutAlsatianAmericanApacheArabArapahoArgentineanArmenianAssyrian/Chaldean/SyriacAustralianAustrianBahamianBangladeshiBarbadianBasqueBelgianBelizeanBermudanBhutaneseBlackfeetBolivianBrazilianBritishBritish West IndianBulgarianBurmeseCajunCambodianCanadianCape VerdeanCarpatho RusynCelticCentral AmericanCentral American IndianCherokeeCheyenneChickasawChileanChineseChippewaChoctawColombianColvilleComancheCosta RicanCreeCreekCroatianCrowCubanCypriotCzechCzechoslovakianDanishDelawareDominicanDutchDutch West IndianEastern EuropeanEcuadorianEgyptianEnglishEstonianEthiopianEuropeanFijianFilipinoFinnishFrenchFrench American IndianFrench CanadianGermanGerman RussianGhanaianGreekGuamanian/ChamorroGuatemalanGuyaneseHaitianHmongHonduranHopiHoumaHungarianIcelanderIndian (Asian)IndonesianInupiatIranianIraqiIrishIroquoisIsraeliItalianJamaicanJapaneseJordanianKenyanKiowaKoreanLaotianLatvianLebaneseLiberianLithuanianLumbeeLuxembourgerMacedonianMalaysianMalteseMarshalleseMenomineeMexicanMexican American IndianMongolianMoroccanNative HawaiianNavajoNepaleseNew ZealanderNicaraguanNigerianNorthern EuropeanNorwegianOkinawanOsageOttawaPaiutePakistaniPalestinianPanamanianParaguayanPennsylvania GermanPeruvianPimaPolishPortuguesePotawatomiPuebloPuerto RicanPuget Sound SalishRomanianRussianSalvadoranSamoanScandinavianScotch-IrishScottishSeminoleSenegaleseSerbianShoshoneSierra LeoneanSiouxSlavicSlovakSloveneSomaliSouth AfricanSouth AmericanSouth American IndianSoviet UnionSpaniardSpanishSpanish AmericanSpanish American IndianSri LankanSubsaharan AfricanSudaneseSwedishSwissSyrianTaiwaneseThaiTlingit-HaidaTohono O'OdhamTonganTrinidadian and TobagonianTsimshianTurkishU.S. Virgin IslanderUgandanUkrainianUruguayanUteVenezuelanVietnameseWelshWest IndianYakamaYaquiYugoslavianYumanYup'ikZimbabwean
Immigration
NonimmigrantsImmigrantsAfghanistanAfricaAlbaniaArgentinaArmeniaAsiaAustraliaAustriaBahamasBangladeshBarbadosBelarusBelgiumBelizeBoliviaBosnia and HerzegovinaBrazilBulgariaBurma/MyanmarCabo VerdeCambodiaCameroonCanadaCaribbeanCentral AmericaChileChinaColombiaCongoCosta RicaCroatiaCubaCzechoslovakiaDenmarkDominicaDominican RepublicEastern AfricaEastern AsiaEastern EuropeEcuadorEgyptEl SalvadorEnglandEritreaEthiopiaEuropeFijiFranceGermanyGhanaGreeceGrenadaGuatemalaGuyanaHaitiHondurasHong KongHungaryIndiaIndonesiaIranIraqIrelandIsraelItalyJamaicaJapanJordanKenyaKoreaKuwaitLaosLatin AmericaLatviaLebanonLiberiaLithuaniaMalaysiaMexicoMicronesiaMiddle AfricaMoldovaMoroccoNepalNetherlandsNicaraguaNigeriaNorth AmericaNorth MacedoniaNorthern AfricaNorthern EuropeNorwayOceaniaPakistanPanamaPeruPhilippinesPolandPortugalRomaniaRussiaSaudi ArabiaScotlandSenegalSerbiaSierra LeoneSingaporeSomaliaSouth AfricaSouth AmericaSouth Central AsiaSouth Eastern AsiaSouthern EuropeSpainSri LankaSt. Vincent and the GrenadinesSudanSwedenSwitzerlandSyriaTaiwanThailandTrinidad and TobagoTurkeyUgandaUkraineUruguayUzbekistanVenezuelaVietnamWest IndiesWestern AfricaWestern AsiaWestern EuropeYemenZaireZimbabweAzores
Immigrants from Kazakhstan
Race
Ancestry
AfghanAfricanAlaska NativeAlaskan AthabascanAlbanianAleutAlsatianAmericanApacheArabArapahoArgentineanArmenianAssyrian/Chaldean/SyriacAustralianAustrianBahamianBangladeshiBarbadianBasqueBelgianBelizeanBermudanBhutaneseBlackfeetBolivianBrazilianBritishBritish West IndianBulgarianBurmeseCajunCambodianCanadianCape VerdeanCarpatho RusynCelticCentral AmericanCentral American IndianCherokeeCheyenneChickasawChileanChineseChippewaChoctawColombianColvilleComancheCosta RicanCreeCreekCroatianCrowCubanCypriotCzechCzechoslovakianDanishDelawareDominicanDutchDutch West IndianEastern EuropeanEcuadorianEgyptianEnglishEstonianEthiopianEuropeanFijianFilipinoFinnishFrenchFrench American IndianFrench CanadianGermanGerman RussianGhanaianGreekGuamanian/ChamorroGuatemalanGuyaneseHaitianHmongHonduranHopiHoumaHungarianIcelanderIndian (Asian)IndonesianInupiatIranianIraqiIrishIroquoisIsraeliItalianJamaicanJapaneseJordanianKenyanKiowaKoreanLaotianLatvianLebaneseLiberianLithuanianLumbeeLuxembourgerMacedonianMalaysianMalteseMarshalleseMenomineeMexicanMexican American IndianMongolianMoroccanNative HawaiianNavajoNepaleseNew ZealanderNicaraguanNigerianNorthern EuropeanNorwegianOkinawanOsageOttawaPaiutePakistaniPalestinianPanamanianParaguayanPennsylvania GermanPeruvianPimaPolishPortuguesePotawatomiPuebloPuerto RicanPuget Sound SalishRomanianRussianSamoanScandinavianScotch-IrishScottishSeminoleSenegaleseSerbianShoshoneSierra LeoneanSiouxSlavicSlovakSloveneSomaliSouth AfricanSouth AmericanSouth American IndianSoviet UnionSpaniardSpanishSpanish AmericanSpanish American IndianSri LankanSubsaharan AfricanSudaneseSwedishSwissSyrianTaiwaneseThaiTlingit-HaidaTohono O'OdhamTonganTrinidadian and TobagonianTsimshianTurkishU.S. Virgin IslanderUgandanUkrainianUruguayanUteVenezuelanVietnameseWelshWest IndianYakamaYaquiYugoslavianYumanYup'ikZimbabwean
Immigration
NonimmigrantsImmigrantsAfghanistanAfricaAlbaniaArgentinaArmeniaAsiaAustraliaAustriaBahamasBangladeshBarbadosBelarusBelgiumBelizeBoliviaBosnia and HerzegovinaBrazilBulgariaBurma/MyanmarCabo VerdeCambodiaCameroonCanadaCaribbeanCentral AmericaChileChinaColombiaCongoCosta RicaCroatiaCubaCzechoslovakiaDenmarkDominicaDominican RepublicEastern AfricaEastern AsiaEastern EuropeEcuadorEgyptEl SalvadorEnglandEritreaEthiopiaEuropeFijiFranceGermanyGhanaGreeceGrenadaGuatemalaGuyanaHaitiHondurasHong KongHungaryIndiaIndonesiaIranIraqIrelandIsraelItalyJamaicaJapanJordanKazakhstanKenyaKoreaKuwaitLaosLatin AmericaLatviaLebanonLiberiaLithuaniaMalaysiaMexicoMicronesiaMiddle AfricaMoldovaMoroccoNepalNetherlandsNicaraguaNigeriaNorth AmericaNorth MacedoniaNorthern AfricaNorthern EuropeNorwayOceaniaPakistanPanamaPeruPhilippinesPolandPortugalRomaniaRussiaSaudi ArabiaScotlandSenegalSerbiaSierra LeoneSingaporeSomaliaSouth AfricaSouth AmericaSouth Central AsiaSouth Eastern AsiaSouthern EuropeSpainSri LankaSt. Vincent and the GrenadinesSudanSwedenSwitzerlandSyriaTaiwanThailandTrinidad and TobagoTurkeyUgandaUkraineUruguayUzbekistanVenezuelaVietnamWest IndiesWestern AfricaWestern AsiaWestern EuropeYemenZaireZimbabweAzores
In Labor Force | Age 35-44
Income
Poverty
Unemployment
Labor Participation
Family Structure
Vehicle Availability
Education Level
Disability

In Labor Force | Age 35-44 Comparison

Salvadorans

Immigrants from Kazakhstan

Tragic
Good
83.6%
IN LABOR FORCE | AGE 35-44
0.4/ 100
METRIC RATING
251st/ 347
METRIC RANK
84.4%
IN LABOR FORCE | AGE 35-44
60.4/ 100
METRIC RATING
160th/ 347
METRIC RANK

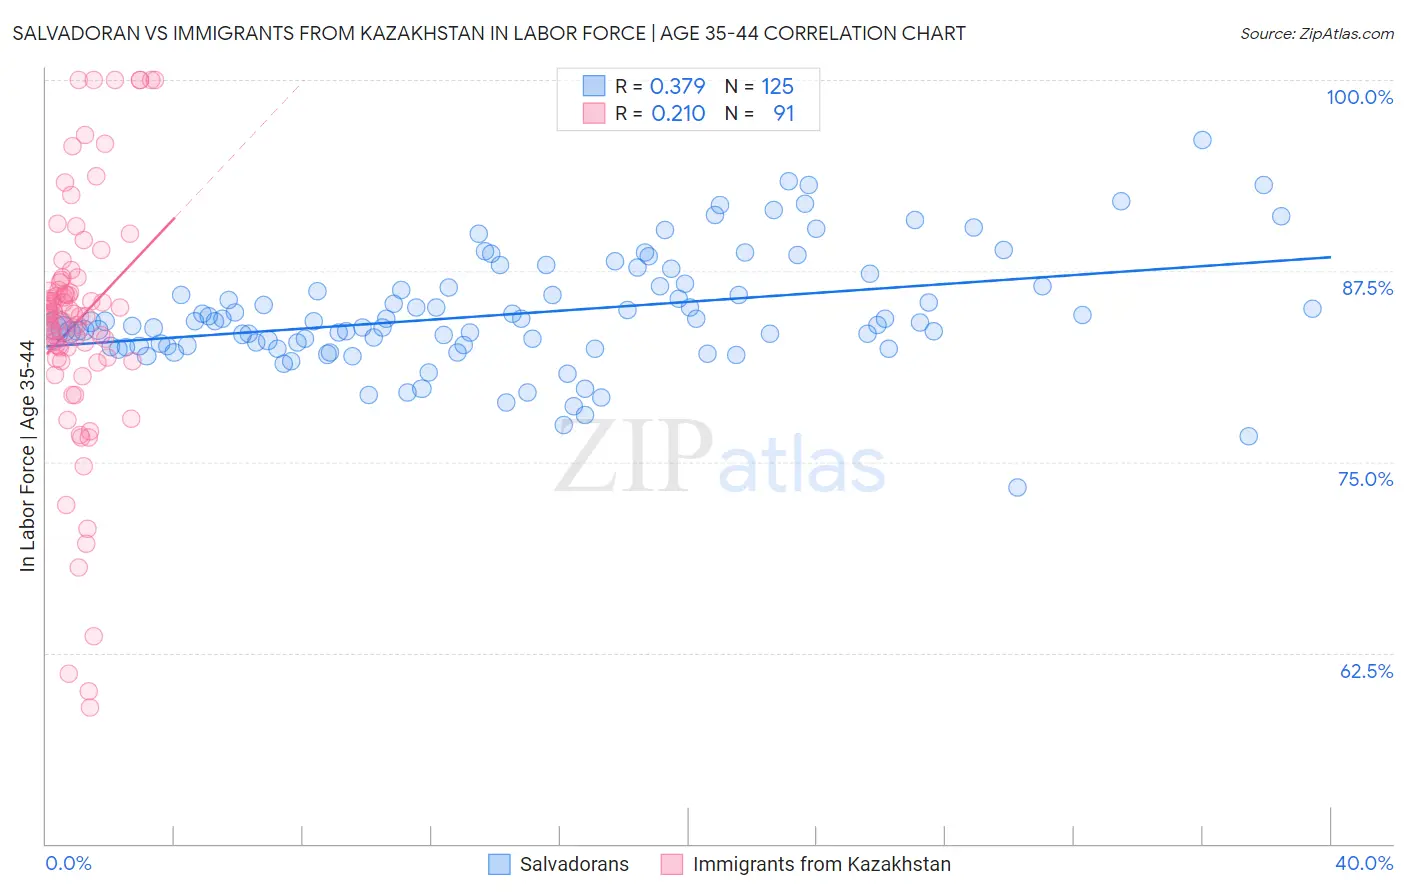
Salvadoran vs Immigrants from Kazakhstan In Labor Force | Age 35-44 Correlation Chart

The statistical analysis conducted on geographies consisting of 398,774,935 people shows a mild positive correlation between the proportion of Salvadorans and labor force participation rate among population between the ages 35 and 44 in the United States with a correlation coefficient (R) of 0.379 and weighted average of 83.6%. Similarly, the statistical analysis conducted on geographies consisting of 124,390,688 people shows a weak positive correlation between the proportion of Immigrants from Kazakhstan and labor force participation rate among population between the ages 35 and 44 in the United States with a correlation coefficient (R) of 0.210 and weighted average of 84.4%, a difference of 0.95%.
Salvadoran vs Immigrants from Kazakhstan In Labor Force | Age 35-44

In Labor Force | Age 35-44 Correlation Summary

MeasurementSalvadoranImmigrants from Kazakhstan
Minimum73.3%58.9%
Maximum96.1%100.0%
Range22.8%41.1%
Mean84.7%84.2%
Median84.1%84.7%
Interquartile 25% (IQ1)82.6%81.8%
Interquartile 75% (IQ3)86.4%86.9%
Interquartile Range (IQR)3.9%5.1%
Standard Deviation (Sample)3.7%8.3%
Standard Deviation (Population)3.7%8.2%

Similar Demographics by In Labor Force | Age 35-44

Demographics Similar to Salvadorans by In Labor Force | Age 35-44

In terms of in labor force | age 35-44, the demographic groups most similar to Salvadorans are Immigrants from Guyana (83.6%, a difference of 0.0%), Lebanese (83.6%, a difference of 0.0%), Tongan (83.6%, a difference of 0.010%), White/Caucasian (83.6%, a difference of 0.020%), and Immigrants from the Azores (83.6%, a difference of 0.040%).
DemographicsRating | RankIn Labor Force | Age 35-44
Guyanese
1.1
/100
|
#244
Tragic
83.8%
Malaysians
1.1
/100
|
#245
Tragic
83.8%
Immigrants | Immigrants
1.0
/100
|
#246
Tragic
83.7%
Immigrants | Armenia
0.9
/100
|
#247
Tragic
83.7%
Indonesians
0.8
/100
|
#248
Tragic
83.7%
Immigrants | St. Vincent and the Grenadines
0.7
/100
|
#249
Tragic
83.7%
Whites/Caucasians
0.5
/100
|
#250
Tragic
83.6%
Salvadorans
0.4
/100
|
#251
Tragic
83.6%
Immigrants | Guyana
0.4
/100
|
#252
Tragic
83.6%
Lebanese
0.4
/100
|
#253
Tragic
83.6%
Tongans
0.4
/100
|
#254
Tragic
83.6%
Immigrants | Azores
0.3
/100
|
#255
Tragic
83.6%
Japanese
0.3
/100
|
#256
Tragic
83.6%
Basques
0.3
/100
|
#257
Tragic
83.6%
Tsimshian
0.2
/100
|
#258
Tragic
83.5%

Demographics Similar to Immigrants from Kazakhstan by In Labor Force | Age 35-44

In terms of in labor force | age 35-44, the demographic groups most similar to Immigrants from Kazakhstan are Immigrants from Senegal (84.4%, a difference of 0.0%), Immigrants from Venezuela (84.4%, a difference of 0.0%), Immigrants from Hungary (84.4%, a difference of 0.010%), Aleut (84.4%, a difference of 0.010%), and Nigerian (84.4%, a difference of 0.010%).
DemographicsRating | RankIn Labor Force | Age 35-44
Trinidadians and Tobagonians
69.5
/100
|
#153
Good
84.5%
Iranians
69.4
/100
|
#154
Good
84.5%
Immigrants | Switzerland
65.9
/100
|
#155
Good
84.5%
Immigrants | Israel
64.3
/100
|
#156
Good
84.4%
Immigrants | Austria
63.8
/100
|
#157
Good
84.4%
Jamaicans
62.7
/100
|
#158
Good
84.4%
Immigrants | Senegal
60.4
/100
|
#159
Good
84.4%
Immigrants | Kazakhstan
60.4
/100
|
#160
Good
84.4%
Immigrants | Venezuela
60.0
/100
|
#161
Good
84.4%
Immigrants | Hungary
59.4
/100
|
#162
Average
84.4%
Aleuts
59.1
/100
|
#163
Average
84.4%
Nigerians
58.9
/100
|
#164
Average
84.4%
Venezuelans
58.1
/100
|
#165
Average
84.4%
Alsatians
55.2
/100
|
#166
Average
84.4%
Immigrants | Portugal
55.2
/100
|
#167
Average
84.4%