Salvadoran vs Immigrants from Belgium In Labor Force | Age 35-44

COMPARE

Salvadoran
Race
Ancestry
AfghanAfricanAlaska NativeAlaskan AthabascanAlbanianAleutAlsatianAmericanApacheArabArapahoArgentineanArmenianAssyrian/Chaldean/SyriacAustralianAustrianBahamianBangladeshiBarbadianBasqueBelgianBelizeanBermudanBhutaneseBlackfeetBolivianBrazilianBritishBritish West IndianBulgarianBurmeseCajunCambodianCanadianCape VerdeanCarpatho RusynCelticCentral AmericanCentral American IndianCherokeeCheyenneChickasawChileanChineseChippewaChoctawColombianColvilleComancheCosta RicanCreeCreekCroatianCrowCubanCypriotCzechCzechoslovakianDanishDelawareDominicanDutchDutch West IndianEastern EuropeanEcuadorianEgyptianEnglishEstonianEthiopianEuropeanFijianFilipinoFinnishFrenchFrench American IndianFrench CanadianGermanGerman RussianGhanaianGreekGuamanian/ChamorroGuatemalanGuyaneseHaitianHmongHonduranHopiHoumaHungarianIcelanderIndian (Asian)IndonesianInupiatIranianIraqiIrishIroquoisIsraeliItalianJamaicanJapaneseJordanianKenyanKiowaKoreanLaotianLatvianLebaneseLiberianLithuanianLumbeeLuxembourgerMacedonianMalaysianMalteseMarshalleseMenomineeMexicanMexican American IndianMongolianMoroccanNative HawaiianNavajoNepaleseNew ZealanderNicaraguanNigerianNorthern EuropeanNorwegianOkinawanOsageOttawaPaiutePakistaniPalestinianPanamanianParaguayanPennsylvania GermanPeruvianPimaPolishPortuguesePotawatomiPuebloPuerto RicanPuget Sound SalishRomanianRussianSalvadoranSamoanScandinavianScotch-IrishScottishSeminoleSenegaleseSerbianShoshoneSierra LeoneanSiouxSlavicSlovakSloveneSomaliSouth AfricanSouth AmericanSouth American IndianSoviet UnionSpaniardSpanishSpanish AmericanSpanish American IndianSri LankanSubsaharan AfricanSudaneseSwedishSwissSyrianTaiwaneseThaiTlingit-HaidaTohono O'OdhamTonganTrinidadian and TobagonianTsimshianTurkishU.S. Virgin IslanderUgandanUkrainianUruguayanUteVenezuelanVietnameseWelshWest IndianYakamaYaquiYugoslavianYumanYup'ikZimbabwean
Immigration
NonimmigrantsImmigrantsAfghanistanAfricaAlbaniaArgentinaArmeniaAsiaAustraliaAustriaBahamasBangladeshBarbadosBelarusBelizeBoliviaBosnia and HerzegovinaBrazilBulgariaBurma/MyanmarCabo VerdeCambodiaCameroonCanadaCaribbeanCentral AmericaChileChinaColombiaCongoCosta RicaCroatiaCubaCzechoslovakiaDenmarkDominicaDominican RepublicEastern AfricaEastern AsiaEastern EuropeEcuadorEgyptEl SalvadorEnglandEritreaEthiopiaEuropeFijiFranceGermanyGhanaGreeceGrenadaGuatemalaGuyanaHaitiHondurasHong KongHungaryIndiaIndonesiaIranIraqIrelandIsraelItalyJamaicaJapanJordanKazakhstanKenyaKoreaKuwaitLaosLatin AmericaLatviaLebanonLiberiaLithuaniaMalaysiaMexicoMicronesiaMiddle AfricaMoldovaMoroccoNepalNetherlandsNicaraguaNigeriaNorth AmericaNorth MacedoniaNorthern AfricaNorthern EuropeNorwayOceaniaPakistanPanamaPeruPhilippinesPolandPortugalRomaniaRussiaSaudi ArabiaScotlandSenegalSerbiaSierra LeoneSingaporeSomaliaSouth AfricaSouth AmericaSouth Central AsiaSouth Eastern AsiaSouthern EuropeSpainSri LankaSt. Vincent and the GrenadinesSudanSwedenSwitzerlandSyriaTaiwanThailandTrinidad and TobagoTurkeyUgandaUkraineUruguayUzbekistanVenezuelaVietnamWest IndiesWestern AfricaWestern AsiaWestern EuropeYemenZaireZimbabweAzores
Immigrants from Belgium
Race
Ancestry
AfghanAfricanAlaska NativeAlaskan AthabascanAlbanianAleutAlsatianAmericanApacheArabArapahoArgentineanArmenianAssyrian/Chaldean/SyriacAustralianAustrianBahamianBangladeshiBarbadianBasqueBelgianBelizeanBermudanBhutaneseBlackfeetBolivianBrazilianBritishBritish West IndianBulgarianBurmeseCajunCambodianCanadianCape VerdeanCarpatho RusynCelticCentral AmericanCentral American IndianCherokeeCheyenneChickasawChileanChineseChippewaChoctawColombianColvilleComancheCosta RicanCreeCreekCroatianCrowCubanCypriotCzechCzechoslovakianDanishDelawareDominicanDutchDutch West IndianEastern EuropeanEcuadorianEgyptianEnglishEstonianEthiopianEuropeanFijianFilipinoFinnishFrenchFrench American IndianFrench CanadianGermanGerman RussianGhanaianGreekGuamanian/ChamorroGuatemalanGuyaneseHaitianHmongHonduranHopiHoumaHungarianIcelanderIndian (Asian)IndonesianInupiatIranianIraqiIrishIroquoisIsraeliItalianJamaicanJapaneseJordanianKenyanKiowaKoreanLaotianLatvianLebaneseLiberianLithuanianLumbeeLuxembourgerMacedonianMalaysianMalteseMarshalleseMenomineeMexicanMexican American IndianMongolianMoroccanNative HawaiianNavajoNepaleseNew ZealanderNicaraguanNigerianNorthern EuropeanNorwegianOkinawanOsageOttawaPaiutePakistaniPalestinianPanamanianParaguayanPennsylvania GermanPeruvianPimaPolishPortuguesePotawatomiPuebloPuerto RicanPuget Sound SalishRomanianRussianSamoanScandinavianScotch-IrishScottishSeminoleSenegaleseSerbianShoshoneSierra LeoneanSiouxSlavicSlovakSloveneSomaliSouth AfricanSouth AmericanSouth American IndianSoviet UnionSpaniardSpanishSpanish AmericanSpanish American IndianSri LankanSubsaharan AfricanSudaneseSwedishSwissSyrianTaiwaneseThaiTlingit-HaidaTohono O'OdhamTonganTrinidadian and TobagonianTsimshianTurkishU.S. Virgin IslanderUgandanUkrainianUruguayanUteVenezuelanVietnameseWelshWest IndianYakamaYaquiYugoslavianYumanYup'ikZimbabwean
Immigration
NonimmigrantsImmigrantsAfghanistanAfricaAlbaniaArgentinaArmeniaAsiaAustraliaAustriaBahamasBangladeshBarbadosBelarusBelgiumBelizeBoliviaBosnia and HerzegovinaBrazilBulgariaBurma/MyanmarCabo VerdeCambodiaCameroonCanadaCaribbeanCentral AmericaChileChinaColombiaCongoCosta RicaCroatiaCubaCzechoslovakiaDenmarkDominicaDominican RepublicEastern AfricaEastern AsiaEastern EuropeEcuadorEgyptEl SalvadorEnglandEritreaEthiopiaEuropeFijiFranceGermanyGhanaGreeceGrenadaGuatemalaGuyanaHaitiHondurasHong KongHungaryIndiaIndonesiaIranIraqIrelandIsraelItalyJamaicaJapanJordanKazakhstanKenyaKoreaKuwaitLaosLatin AmericaLatviaLebanonLiberiaLithuaniaMalaysiaMexicoMicronesiaMiddle AfricaMoldovaMoroccoNepalNetherlandsNicaraguaNigeriaNorth AmericaNorth MacedoniaNorthern AfricaNorthern EuropeNorwayOceaniaPakistanPanamaPeruPhilippinesPolandPortugalRomaniaRussiaSaudi ArabiaScotlandSenegalSerbiaSierra LeoneSingaporeSomaliaSouth AfricaSouth AmericaSouth Central AsiaSouth Eastern AsiaSouthern EuropeSpainSri LankaSt. Vincent and the GrenadinesSudanSwedenSwitzerlandSyriaTaiwanThailandTrinidad and TobagoTurkeyUgandaUkraineUruguayUzbekistanVenezuelaVietnamWest IndiesWestern AfricaWestern AsiaWestern EuropeYemenZaireZimbabweAzores
In Labor Force | Age 35-44
Income
Poverty
Unemployment
Labor Participation
Family Structure
Vehicle Availability
Education Level
Disability

In Labor Force | Age 35-44 Comparison

Salvadorans

Immigrants from Belgium

Tragic
Excellent
83.6%
IN LABOR FORCE | AGE 35-44
0.4/ 100
METRIC RATING
251st/ 347
METRIC RANK
84.6%
IN LABOR FORCE | AGE 35-44
80.8/ 100
METRIC RATING
141st/ 347
METRIC RANK

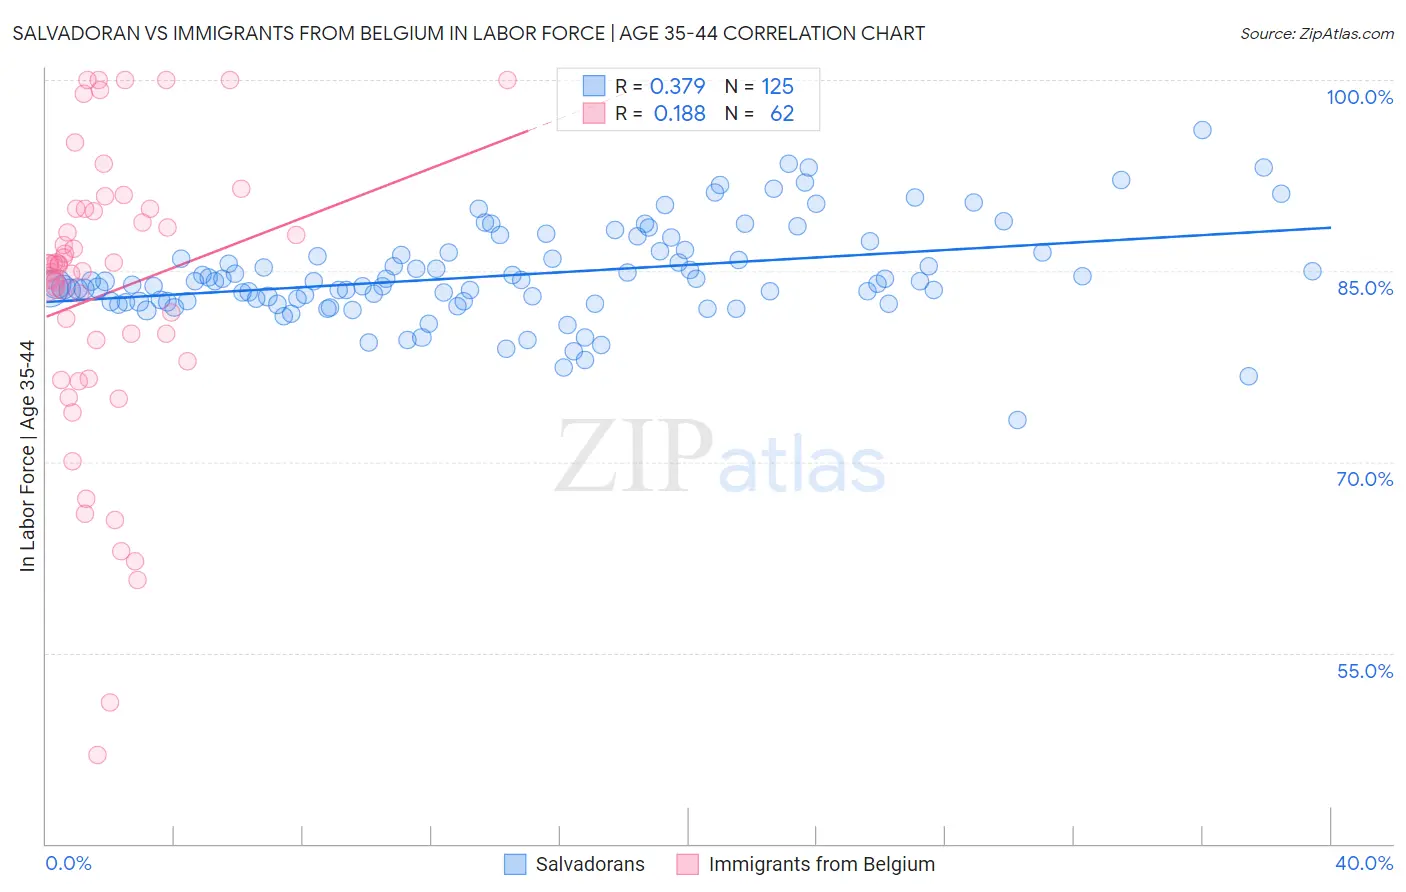
Salvadoran vs Immigrants from Belgium In Labor Force | Age 35-44 Correlation Chart

The statistical analysis conducted on geographies consisting of 398,774,935 people shows a mild positive correlation between the proportion of Salvadorans and labor force participation rate among population between the ages 35 and 44 in the United States with a correlation coefficient (R) of 0.379 and weighted average of 83.6%. Similarly, the statistical analysis conducted on geographies consisting of 146,708,187 people shows a poor positive correlation between the proportion of Immigrants from Belgium and labor force participation rate among population between the ages 35 and 44 in the United States with a correlation coefficient (R) of 0.188 and weighted average of 84.6%, a difference of 1.1%.
Salvadoran vs Immigrants from Belgium In Labor Force | Age 35-44

In Labor Force | Age 35-44 Correlation Summary

MeasurementSalvadoranImmigrants from Belgium
Minimum73.3%47.0%
Maximum96.1%100.0%
Range22.8%53.0%
Mean84.7%83.2%
Median84.1%85.4%
Interquartile 25% (IQ1)82.6%77.9%
Interquartile 75% (IQ3)86.4%89.9%
Interquartile Range (IQR)3.9%12.0%
Standard Deviation (Sample)3.7%11.6%
Standard Deviation (Population)3.7%11.5%

Similar Demographics by In Labor Force | Age 35-44

Demographics Similar to Salvadorans by In Labor Force | Age 35-44

In terms of in labor force | age 35-44, the demographic groups most similar to Salvadorans are Immigrants from Guyana (83.6%, a difference of 0.0%), Lebanese (83.6%, a difference of 0.0%), Tongan (83.6%, a difference of 0.010%), White/Caucasian (83.6%, a difference of 0.020%), and Immigrants from the Azores (83.6%, a difference of 0.040%).
DemographicsRating | RankIn Labor Force | Age 35-44
Guyanese
1.1
/100
|
#244
Tragic
83.8%
Malaysians
1.1
/100
|
#245
Tragic
83.8%
Immigrants | Immigrants
1.0
/100
|
#246
Tragic
83.7%
Immigrants | Armenia
0.9
/100
|
#247
Tragic
83.7%
Indonesians
0.8
/100
|
#248
Tragic
83.7%
Immigrants | St. Vincent and the Grenadines
0.7
/100
|
#249
Tragic
83.7%
Whites/Caucasians
0.5
/100
|
#250
Tragic
83.6%
Salvadorans
0.4
/100
|
#251
Tragic
83.6%
Immigrants | Guyana
0.4
/100
|
#252
Tragic
83.6%
Lebanese
0.4
/100
|
#253
Tragic
83.6%
Tongans
0.4
/100
|
#254
Tragic
83.6%
Immigrants | Azores
0.3
/100
|
#255
Tragic
83.6%
Japanese
0.3
/100
|
#256
Tragic
83.6%
Basques
0.3
/100
|
#257
Tragic
83.6%
Tsimshian
0.2
/100
|
#258
Tragic
83.5%

Demographics Similar to Immigrants from Belgium by In Labor Force | Age 35-44

In terms of in labor force | age 35-44, the demographic groups most similar to Immigrants from Belgium are Immigrants from Japan (84.6%, a difference of 0.010%), Immigrants from Uruguay (84.6%, a difference of 0.010%), Immigrants from Ukraine (84.6%, a difference of 0.010%), Immigrants from Jamaica (84.6%, a difference of 0.010%), and Immigrants from Saudi Arabia (84.6%, a difference of 0.010%).
DemographicsRating | RankIn Labor Force | Age 35-44
Immigrants | Korea
88.2
/100
|
#134
Excellent
84.6%
Immigrants | Malaysia
87.5
/100
|
#135
Excellent
84.6%
Afghans
86.3
/100
|
#136
Excellent
84.6%
Immigrants | Chile
84.6
/100
|
#137
Excellent
84.6%
Czechoslovakians
82.6
/100
|
#138
Excellent
84.6%
Immigrants | Zaire
82.5
/100
|
#139
Excellent
84.6%
Immigrants | Japan
81.4
/100
|
#140
Excellent
84.6%
Immigrants | Belgium
80.8
/100
|
#141
Excellent
84.6%
Immigrants | Uruguay
80.1
/100
|
#142
Excellent
84.6%
Immigrants | Ukraine
79.7
/100
|
#143
Good
84.6%
Immigrants | Jamaica
79.4
/100
|
#144
Good
84.6%
Immigrants | Saudi Arabia
79.4
/100
|
#145
Good
84.6%
Immigrants | Asia
78.7
/100
|
#146
Good
84.5%
Immigrants | Netherlands
76.6
/100
|
#147
Good
84.5%
South American Indians
73.6
/100
|
#148
Good
84.5%