Russian vs Dutch West Indian In Labor Force | Age 16-19
COMPARE
Russian
Dutch West Indian
In Labor Force | Age 16-19
In Labor Force | Age 16-19 Comparison
Russians
Dutch West Indians
36.7%
IN LABOR FORCE | AGE 16-19
57.5/ 100
METRIC RATING
173rd/ 347
METRIC RANK
35.6%
IN LABOR FORCE | AGE 16-19
10.7/ 100
METRIC RATING
216th/ 347
METRIC RANK
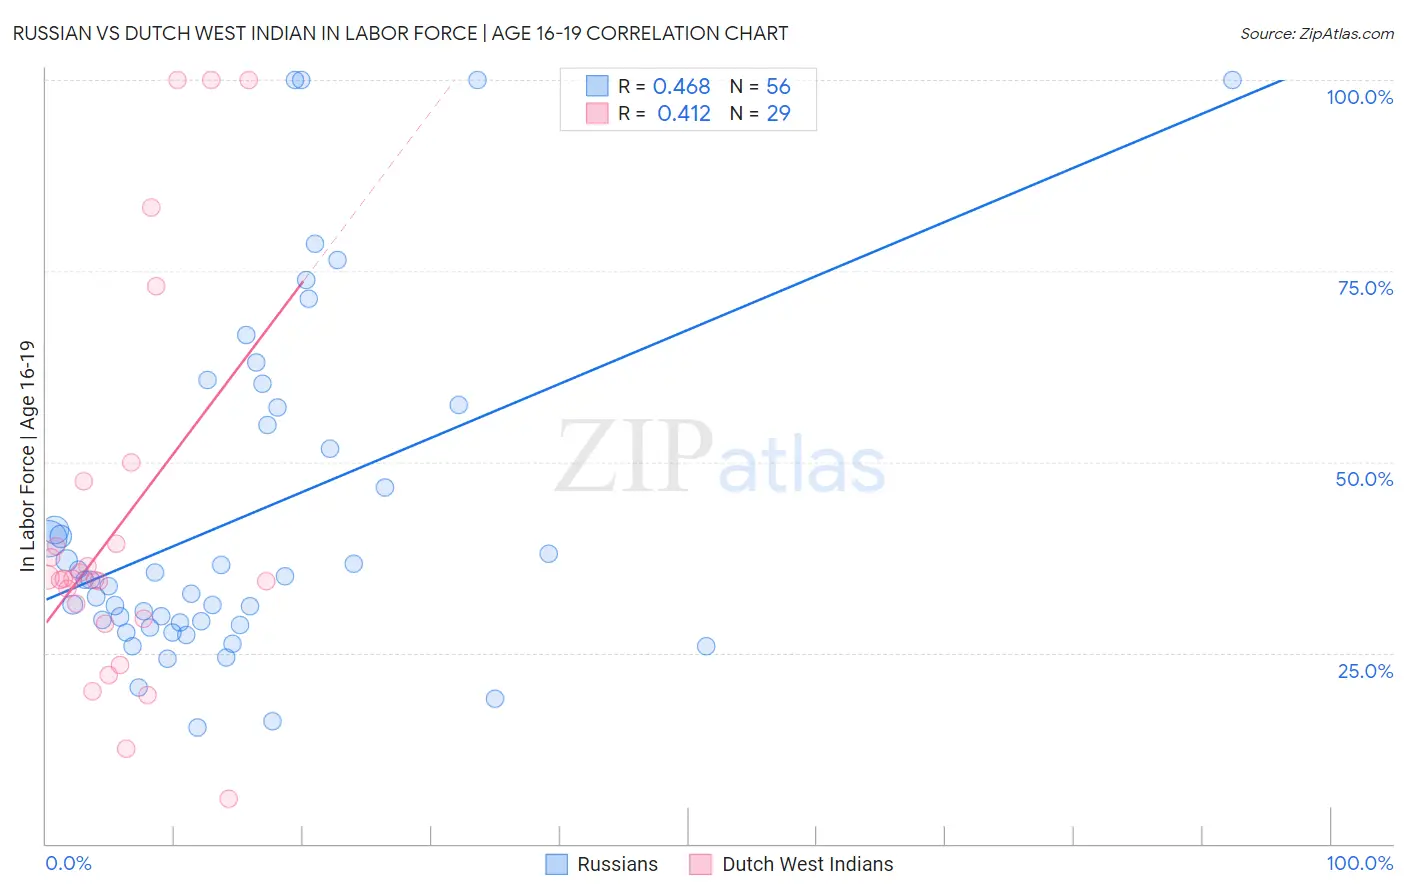
Russian vs Dutch West Indian In Labor Force | Age 16-19 Correlation Chart
The statistical analysis conducted on geographies consisting of 510,287,384 people shows a moderate positive correlation between the proportion of Russians and labor force participation rate among population between the ages 16 and 19 in the United States with a correlation coefficient (R) of 0.468 and weighted average of 36.7%. Similarly, the statistical analysis conducted on geographies consisting of 85,687,209 people shows a moderate positive correlation between the proportion of Dutch West Indians and labor force participation rate among population between the ages 16 and 19 in the United States with a correlation coefficient (R) of 0.412 and weighted average of 35.6%, a difference of 3.1%.
In Labor Force | Age 16-19 Correlation Summary
| Measurement | Russian | Dutch West Indian |
| Minimum | 15.3% | 5.9% |
| Maximum | 100.0% | 100.0% |
| Range | 84.7% | 94.1% |
| Mean | 42.9% | 41.7% |
| Median | 34.6% | 34.6% |
| Interquartile 25% (IQ1) | 28.8% | 29.1% |
| Interquartile 75% (IQ3) | 56.0% | 43.4% |
| Interquartile Range (IQR) | 27.2% | 14.3% |
| Standard Deviation (Sample) | 22.2% | 25.2% |
| Standard Deviation (Population) | 22.0% | 24.8% |
Similar Demographics by In Labor Force | Age 16-19
Demographics Similar to Russians by In Labor Force | Age 16-19
In terms of in labor force | age 16-19, the demographic groups most similar to Russians are Immigrants from Cambodia (36.7%, a difference of 0.040%), South African (36.7%, a difference of 0.040%), Immigrants from South Africa (36.8%, a difference of 0.15%), Immigrants from Latvia (36.8%, a difference of 0.21%), and Palestinian (36.8%, a difference of 0.29%).
| Demographics | Rating | Rank | In Labor Force | Age 16-19 |
| Immigrants | Western Africa | 66.7 /100 | #166 | Good 36.9% |
| Arabs | 63.6 /100 | #167 | Good 36.8% |
| Palestinians | 63.1 /100 | #168 | Good 36.8% |
| Immigrants | Latvia | 61.6 /100 | #169 | Good 36.8% |
| Immigrants | South Africa | 60.5 /100 | #170 | Good 36.8% |
| Immigrants | Cambodia | 58.4 /100 | #171 | Average 36.7% |
| South Africans | 58.3 /100 | #172 | Average 36.7% |
| Russians | 57.5 /100 | #173 | Average 36.7% |
| Immigrants | Czechoslovakia | 50.0 /100 | #174 | Average 36.6% |
| Natives/Alaskans | 49.0 /100 | #175 | Average 36.6% |
| Albanians | 48.8 /100 | #176 | Average 36.5% |
| Immigrants | Northern Europe | 46.6 /100 | #177 | Average 36.5% |
| Blacks/African Americans | 45.1 /100 | #178 | Average 36.5% |
| Immigrants | Southern Europe | 43.3 /100 | #179 | Average 36.4% |
| Immigrants | Morocco | 41.1 /100 | #180 | Average 36.4% |
Demographics Similar to Dutch West Indians by In Labor Force | Age 16-19
In terms of in labor force | age 16-19, the demographic groups most similar to Dutch West Indians are Immigrants from Costa Rica (35.6%, a difference of 0.0%), Immigrants from South Eastern Asia (35.6%, a difference of 0.020%), Apache (35.6%, a difference of 0.040%), Houma (35.6%, a difference of 0.050%), and Immigrants from Bolivia (35.6%, a difference of 0.050%).
| Demographics | Rating | Rank | In Labor Force | Age 16-19 |
| Moroccans | 12.7 /100 | #209 | Poor 35.7% |
| Immigrants | Switzerland | 11.9 /100 | #210 | Poor 35.6% |
| Mexicans | 11.9 /100 | #211 | Poor 35.6% |
| Houma | 11.0 /100 | #212 | Poor 35.6% |
| Immigrants | Bolivia | 11.0 /100 | #213 | Poor 35.6% |
| Apache | 11.0 /100 | #214 | Poor 35.6% |
| Immigrants | South Eastern Asia | 10.8 /100 | #215 | Poor 35.6% |
| Dutch West Indians | 10.7 /100 | #216 | Poor 35.6% |
| Immigrants | Costa Rica | 10.7 /100 | #217 | Poor 35.6% |
| Sri Lankans | 9.8 /100 | #218 | Tragic 35.5% |
| Guatemalans | 8.6 /100 | #219 | Tragic 35.5% |
| Immigrants | Bahamas | 8.3 /100 | #220 | Tragic 35.5% |
| Turks | 7.3 /100 | #221 | Tragic 35.4% |
| Immigrants | Ghana | 7.3 /100 | #222 | Tragic 35.4% |
| Ghanaians | 6.5 /100 | #223 | Tragic 35.3% |