Russian vs French In Labor Force | Age 16-19
COMPARE
Russian
French
In Labor Force | Age 16-19
In Labor Force | Age 16-19 Comparison
Russians
French
36.7%
IN LABOR FORCE | AGE 16-19
57.5/ 100
METRIC RATING
173rd/ 347
METRIC RANK
42.1%
IN LABOR FORCE | AGE 16-19
100.0/ 100
METRIC RATING
29th/ 347
METRIC RANK
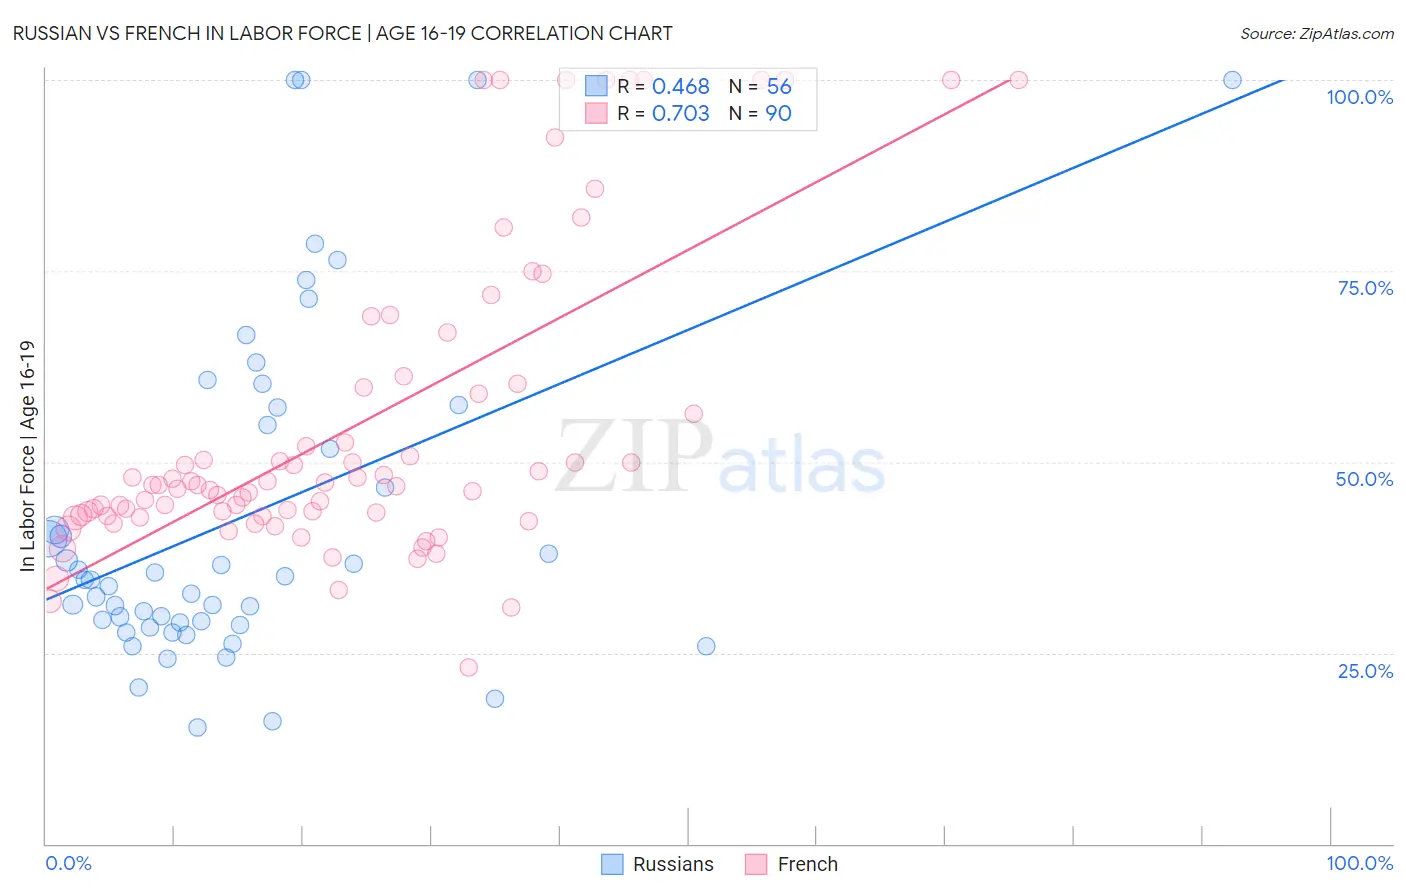
Russian vs French In Labor Force | Age 16-19 Correlation Chart
The statistical analysis conducted on geographies consisting of 510,287,384 people shows a moderate positive correlation between the proportion of Russians and labor force participation rate among population between the ages 16 and 19 in the United States with a correlation coefficient (R) of 0.468 and weighted average of 36.7%. Similarly, the statistical analysis conducted on geographies consisting of 568,177,224 people shows a strong positive correlation between the proportion of French and labor force participation rate among population between the ages 16 and 19 in the United States with a correlation coefficient (R) of 0.703 and weighted average of 42.1%, a difference of 14.7%.
In Labor Force | Age 16-19 Correlation Summary
| Measurement | Russian | French |
| Minimum | 15.3% | 23.1% |
| Maximum | 100.0% | 100.0% |
| Range | 84.7% | 76.9% |
| Mean | 42.9% | 54.6% |
| Median | 34.6% | 47.0% |
| Interquartile 25% (IQ1) | 28.8% | 43.0% |
| Interquartile 75% (IQ3) | 56.0% | 59.8% |
| Interquartile Range (IQR) | 27.2% | 16.9% |
| Standard Deviation (Sample) | 22.2% | 20.0% |
| Standard Deviation (Population) | 22.0% | 19.9% |
Similar Demographics by In Labor Force | Age 16-19
Demographics Similar to Russians by In Labor Force | Age 16-19
In terms of in labor force | age 16-19, the demographic groups most similar to Russians are Immigrants from Cambodia (36.7%, a difference of 0.040%), South African (36.7%, a difference of 0.040%), Immigrants from South Africa (36.8%, a difference of 0.15%), Immigrants from Latvia (36.8%, a difference of 0.21%), and Palestinian (36.8%, a difference of 0.29%).
| Demographics | Rating | Rank | In Labor Force | Age 16-19 |
| Immigrants | Western Africa | 66.7 /100 | #166 | Good 36.9% |
| Arabs | 63.6 /100 | #167 | Good 36.8% |
| Palestinians | 63.1 /100 | #168 | Good 36.8% |
| Immigrants | Latvia | 61.6 /100 | #169 | Good 36.8% |
| Immigrants | South Africa | 60.5 /100 | #170 | Good 36.8% |
| Immigrants | Cambodia | 58.4 /100 | #171 | Average 36.7% |
| South Africans | 58.3 /100 | #172 | Average 36.7% |
| Russians | 57.5 /100 | #173 | Average 36.7% |
| Immigrants | Czechoslovakia | 50.0 /100 | #174 | Average 36.6% |
| Natives/Alaskans | 49.0 /100 | #175 | Average 36.6% |
| Albanians | 48.8 /100 | #176 | Average 36.5% |
| Immigrants | Northern Europe | 46.6 /100 | #177 | Average 36.5% |
| Blacks/African Americans | 45.1 /100 | #178 | Average 36.5% |
| Immigrants | Southern Europe | 43.3 /100 | #179 | Average 36.4% |
| Immigrants | Morocco | 41.1 /100 | #180 | Average 36.4% |
Demographics Similar to French by In Labor Force | Age 16-19
In terms of in labor force | age 16-19, the demographic groups most similar to French are Polish (42.1%, a difference of 0.050%), Scottish (42.0%, a difference of 0.28%), Welsh (42.3%, a difference of 0.35%), Irish (42.0%, a difference of 0.35%), and Czechoslovakian (41.9%, a difference of 0.55%).
| Demographics | Rating | Rank | In Labor Force | Age 16-19 |
| Sudanese | 100.0 /100 | #22 | Exceptional 42.9% |
| Slovaks | 100.0 /100 | #23 | Exceptional 42.6% |
| Bangladeshis | 100.0 /100 | #24 | Exceptional 42.5% |
| German Russians | 100.0 /100 | #25 | Exceptional 42.4% |
| English | 100.0 /100 | #26 | Exceptional 42.4% |
| Welsh | 100.0 /100 | #27 | Exceptional 42.3% |
| Poles | 100.0 /100 | #28 | Exceptional 42.1% |
| French | 100.0 /100 | #29 | Exceptional 42.1% |
| Scottish | 100.0 /100 | #30 | Exceptional 42.0% |
| Irish | 100.0 /100 | #31 | Exceptional 42.0% |
| Czechoslovakians | 100.0 /100 | #32 | Exceptional 41.9% |
| Liberians | 100.0 /100 | #33 | Exceptional 41.8% |
| Immigrants | Bosnia and Herzegovina | 100.0 /100 | #34 | Exceptional 41.8% |
| Yugoslavians | 100.0 /100 | #35 | Exceptional 41.8% |
| Immigrants | Azores | 100.0 /100 | #36 | Exceptional 41.7% |