Romanian vs Navajo In Labor Force | Age 30-34
COMPARE
Romanian
Navajo
In Labor Force | Age 30-34
In Labor Force | Age 30-34 Comparison
Romanians
Navajo
84.8%
IN LABOR FORCE | AGE 30-34
73.5/ 100
METRIC RATING
152nd/ 347
METRIC RANK
73.8%
IN LABOR FORCE | AGE 30-34
0.0/ 100
METRIC RATING
347th/ 347
METRIC RANK
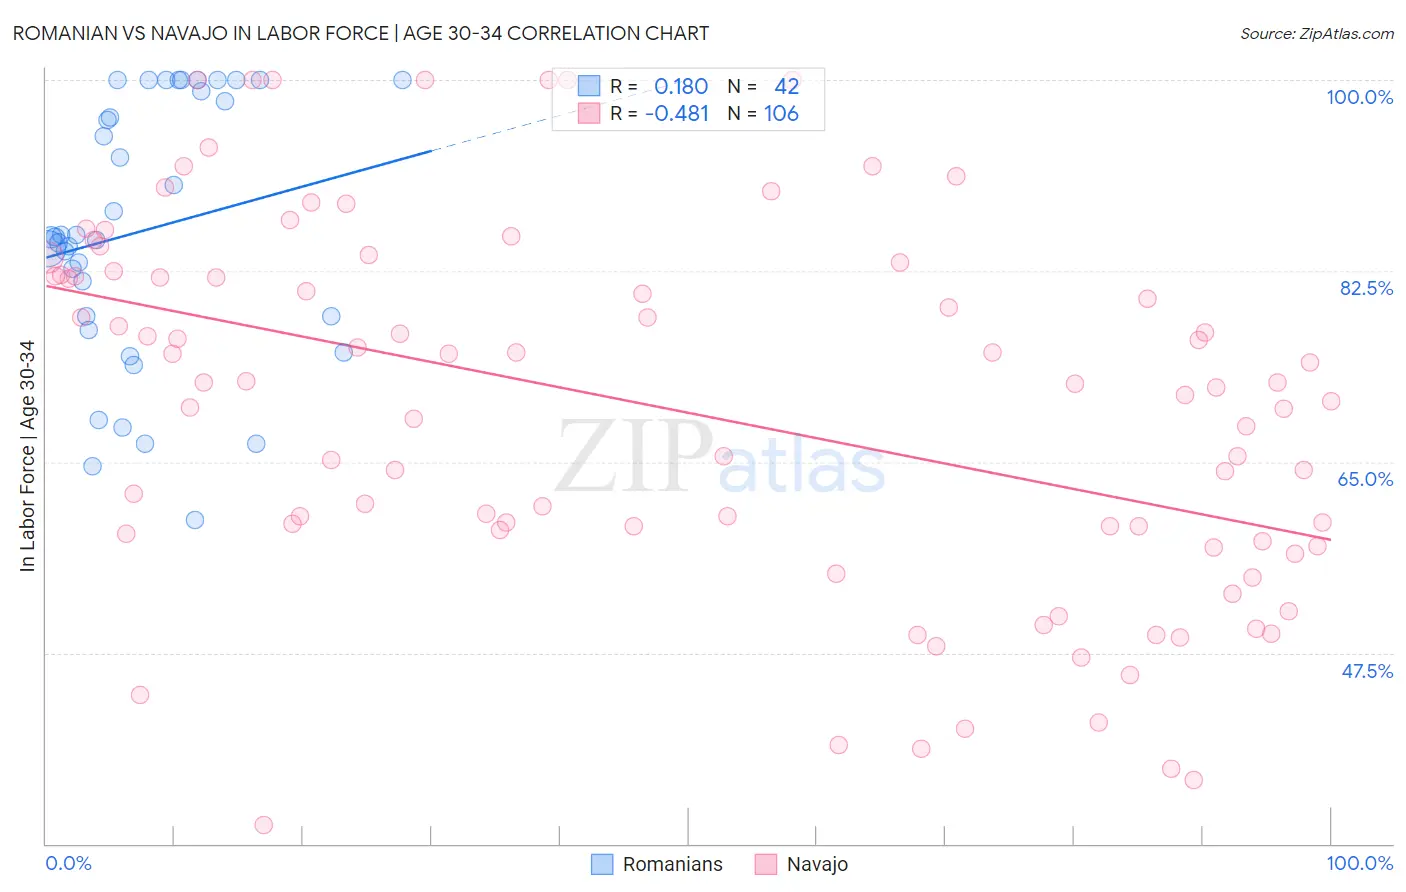
Romanian vs Navajo In Labor Force | Age 30-34 Correlation Chart
The statistical analysis conducted on geographies consisting of 377,700,007 people shows a poor positive correlation between the proportion of Romanians and labor force participation rate among population between the ages 30 and 34 in the United States with a correlation coefficient (R) of 0.180 and weighted average of 84.8%. Similarly, the statistical analysis conducted on geographies consisting of 224,771,118 people shows a moderate negative correlation between the proportion of Navajo and labor force participation rate among population between the ages 30 and 34 in the United States with a correlation coefficient (R) of -0.481 and weighted average of 73.8%, a difference of 15.0%.
In Labor Force | Age 30-34 Correlation Summary
| Measurement | Romanian | Navajo |
| Minimum | 59.7% | 31.7% |
| Maximum | 100.0% | 100.0% |
| Range | 40.3% | 68.3% |
| Mean | 86.2% | 69.8% |
| Median | 85.6% | 72.0% |
| Interquartile 25% (IQ1) | 78.3% | 58.5% |
| Interquartile 75% (IQ3) | 99.0% | 82.0% |
| Interquartile Range (IQR) | 20.7% | 23.6% |
| Standard Deviation (Sample) | 11.9% | 16.9% |
| Standard Deviation (Population) | 11.7% | 16.8% |
Similar Demographics by In Labor Force | Age 30-34
Demographics Similar to Romanians by In Labor Force | Age 30-34
In terms of in labor force | age 30-34, the demographic groups most similar to Romanians are Immigrants from Senegal (84.8%, a difference of 0.0%), German (84.8%, a difference of 0.010%), Immigrants from Ukraine (84.8%, a difference of 0.020%), Immigrants from Saudi Arabia (84.9%, a difference of 0.030%), and Immigrants from Colombia (84.9%, a difference of 0.030%).
| Demographics | Rating | Rank | In Labor Force | Age 30-34 |
| Palestinians | 77.7 /100 | #145 | Good 84.9% |
| Immigrants | Saudi Arabia | 76.6 /100 | #146 | Good 84.9% |
| Immigrants | Colombia | 76.3 /100 | #147 | Good 84.9% |
| Immigrants | Pakistan | 76.2 /100 | #148 | Good 84.9% |
| Immigrants | Ukraine | 75.1 /100 | #149 | Good 84.8% |
| Germans | 75.1 /100 | #150 | Good 84.8% |
| Immigrants | Senegal | 74.0 /100 | #151 | Good 84.8% |
| Romanians | 73.5 /100 | #152 | Good 84.8% |
| Syrians | 70.1 /100 | #153 | Good 84.8% |
| Northern Europeans | 70.0 /100 | #154 | Good 84.8% |
| Immigrants | Sudan | 69.5 /100 | #155 | Good 84.8% |
| French Canadians | 67.3 /100 | #156 | Good 84.8% |
| Peruvians | 65.9 /100 | #157 | Good 84.8% |
| Immigrants | Armenia | 64.7 /100 | #158 | Good 84.8% |
| Czechoslovakians | 63.0 /100 | #159 | Good 84.8% |
Demographics Similar to Navajo by In Labor Force | Age 30-34
In terms of in labor force | age 30-34, the demographic groups most similar to Navajo are Crow (75.9%, a difference of 2.9%), Yup'ik (76.4%, a difference of 3.6%), Yuman (77.1%, a difference of 4.5%), Lumbee (77.3%, a difference of 4.8%), and Tohono O'odham (77.7%, a difference of 5.4%).
| Demographics | Rating | Rank | In Labor Force | Age 30-34 |
| Inupiat | 0.0 /100 | #333 | Tragic 79.7% |
| Hopi | 0.0 /100 | #334 | Tragic 79.3% |
| Marshallese | 0.0 /100 | #335 | Tragic 79.2% |
| Natives/Alaskans | 0.0 /100 | #336 | Tragic 79.2% |
| Yakama | 0.0 /100 | #337 | Tragic 79.1% |
| Pima | 0.0 /100 | #338 | Tragic 79.0% |
| Apache | 0.0 /100 | #339 | Tragic 79.0% |
| Ute | 0.0 /100 | #340 | Tragic 78.9% |
| Immigrants | Yemen | 0.0 /100 | #341 | Tragic 78.2% |
| Tohono O'odham | 0.0 /100 | #342 | Tragic 77.7% |
| Lumbee | 0.0 /100 | #343 | Tragic 77.3% |
| Yuman | 0.0 /100 | #344 | Tragic 77.1% |
| Yup'ik | 0.0 /100 | #345 | Tragic 76.4% |
| Crow | 0.0 /100 | #346 | Tragic 75.9% |
| Navajo | 0.0 /100 | #347 | Tragic 73.8% |