Hispanic or Latino vs Immigrants from Bulgaria In Labor Force | Age 30-34
COMPARE
Hispanic or Latino
Immigrants from Bulgaria
In Labor Force | Age 30-34
In Labor Force | Age 30-34 Comparison
Hispanics or Latinos
Immigrants from Bulgaria
82.4%
IN LABOR FORCE | AGE 30-34
0.0/ 100
METRIC RATING
301st/ 347
METRIC RANK
86.0%
IN LABOR FORCE | AGE 30-34
100.0/ 100
METRIC RATING
21st/ 347
METRIC RANK
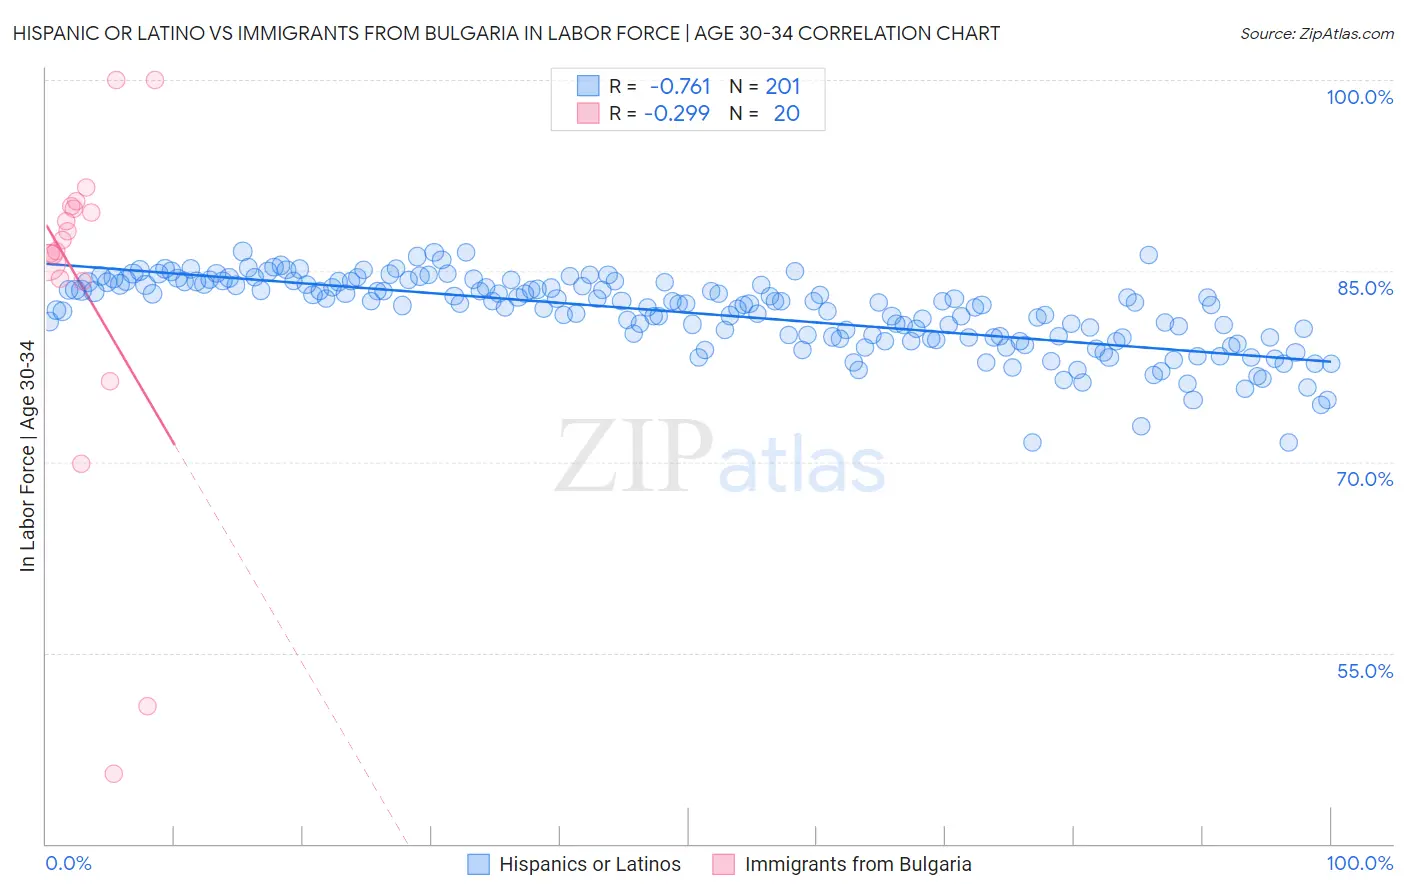
Hispanic or Latino vs Immigrants from Bulgaria In Labor Force | Age 30-34 Correlation Chart
The statistical analysis conducted on geographies consisting of 576,977,639 people shows a strong negative correlation between the proportion of Hispanics or Latinos and labor force participation rate among population between the ages 30 and 34 in the United States with a correlation coefficient (R) of -0.761 and weighted average of 82.4%. Similarly, the statistical analysis conducted on geographies consisting of 172,547,682 people shows a weak negative correlation between the proportion of Immigrants from Bulgaria and labor force participation rate among population between the ages 30 and 34 in the United States with a correlation coefficient (R) of -0.299 and weighted average of 86.0%, a difference of 4.3%.
In Labor Force | Age 30-34 Correlation Summary
| Measurement | Hispanic or Latino | Immigrants from Bulgaria |
| Minimum | 71.5% | 45.5% |
| Maximum | 86.5% | 100.0% |
| Range | 15.0% | 54.5% |
| Mean | 81.7% | 83.6% |
| Median | 82.4% | 87.0% |
| Interquartile 25% (IQ1) | 79.8% | 84.3% |
| Interquartile 75% (IQ3) | 84.0% | 90.0% |
| Interquartile Range (IQR) | 4.3% | 5.7% |
| Standard Deviation (Sample) | 2.9% | 13.8% |
| Standard Deviation (Population) | 2.9% | 13.5% |
Similar Demographics by In Labor Force | Age 30-34
Demographics Similar to Hispanics or Latinos by In Labor Force | Age 30-34
In terms of in labor force | age 30-34, the demographic groups most similar to Hispanics or Latinos are Hmong (82.4%, a difference of 0.010%), Ottawa (82.4%, a difference of 0.030%), Immigrants from Micronesia (82.4%, a difference of 0.040%), Immigrants from Central America (82.5%, a difference of 0.070%), and Tlingit-Haida (82.3%, a difference of 0.12%).
| Demographics | Rating | Rank | In Labor Force | Age 30-34 |
| Americans | 0.0 /100 | #294 | Tragic 82.7% |
| Pennsylvania Germans | 0.0 /100 | #295 | Tragic 82.6% |
| Chippewa | 0.0 /100 | #296 | Tragic 82.6% |
| Comanche | 0.0 /100 | #297 | Tragic 82.6% |
| Aleuts | 0.0 /100 | #298 | Tragic 82.6% |
| Immigrants | Central America | 0.0 /100 | #299 | Tragic 82.5% |
| Hmong | 0.0 /100 | #300 | Tragic 82.4% |
| Hispanics or Latinos | 0.0 /100 | #301 | Tragic 82.4% |
| Ottawa | 0.0 /100 | #302 | Tragic 82.4% |
| Immigrants | Micronesia | 0.0 /100 | #303 | Tragic 82.4% |
| Tlingit-Haida | 0.0 /100 | #304 | Tragic 82.3% |
| Osage | 0.0 /100 | #305 | Tragic 82.3% |
| Spanish American Indians | 0.0 /100 | #306 | Tragic 82.2% |
| Menominee | 0.0 /100 | #307 | Tragic 82.2% |
| Puget Sound Salish | 0.0 /100 | #308 | Tragic 82.1% |
Demographics Similar to Immigrants from Bulgaria by In Labor Force | Age 30-34
In terms of in labor force | age 30-34, the demographic groups most similar to Immigrants from Bulgaria are Bulgarian (86.0%, a difference of 0.0%), Sierra Leonean (86.0%, a difference of 0.010%), Bermudan (85.9%, a difference of 0.020%), Estonian (85.9%, a difference of 0.030%), and Immigrants from Eritrea (85.9%, a difference of 0.040%).
| Demographics | Rating | Rank | In Labor Force | Age 30-34 |
| Immigrants | Cabo Verde | 100.0 /100 | #14 | Exceptional 86.1% |
| Immigrants | Albania | 100.0 /100 | #15 | Exceptional 86.1% |
| Latvians | 100.0 /100 | #16 | Exceptional 86.0% |
| Immigrants | Cameroon | 100.0 /100 | #17 | Exceptional 86.0% |
| Immigrants | Sierra Leone | 100.0 /100 | #18 | Exceptional 86.0% |
| Sierra Leoneans | 100.0 /100 | #19 | Exceptional 86.0% |
| Bulgarians | 100.0 /100 | #20 | Exceptional 86.0% |
| Immigrants | Bulgaria | 100.0 /100 | #21 | Exceptional 86.0% |
| Bermudans | 100.0 /100 | #22 | Exceptional 85.9% |
| Estonians | 100.0 /100 | #23 | Exceptional 85.9% |
| Immigrants | Eritrea | 100.0 /100 | #24 | Exceptional 85.9% |
| Immigrants | North Macedonia | 100.0 /100 | #25 | Exceptional 85.9% |
| Immigrants | Eastern Africa | 100.0 /100 | #26 | Exceptional 85.9% |
| Immigrants | Liberia | 100.0 /100 | #27 | Exceptional 85.9% |
| Immigrants | Latvia | 100.0 /100 | #28 | Exceptional 85.9% |