Bahamian vs Danish In Labor Force | Age 35-44
COMPARE
Bahamian
Danish
In Labor Force | Age 35-44
In Labor Force | Age 35-44 Comparison
Bahamians
Danes
84.7%
IN LABOR FORCE | AGE 35-44
93.2/ 100
METRIC RATING
115th/ 347
METRIC RANK
84.3%
IN LABOR FORCE | AGE 35-44
38.8/ 100
METRIC RATING
180th/ 347
METRIC RANK
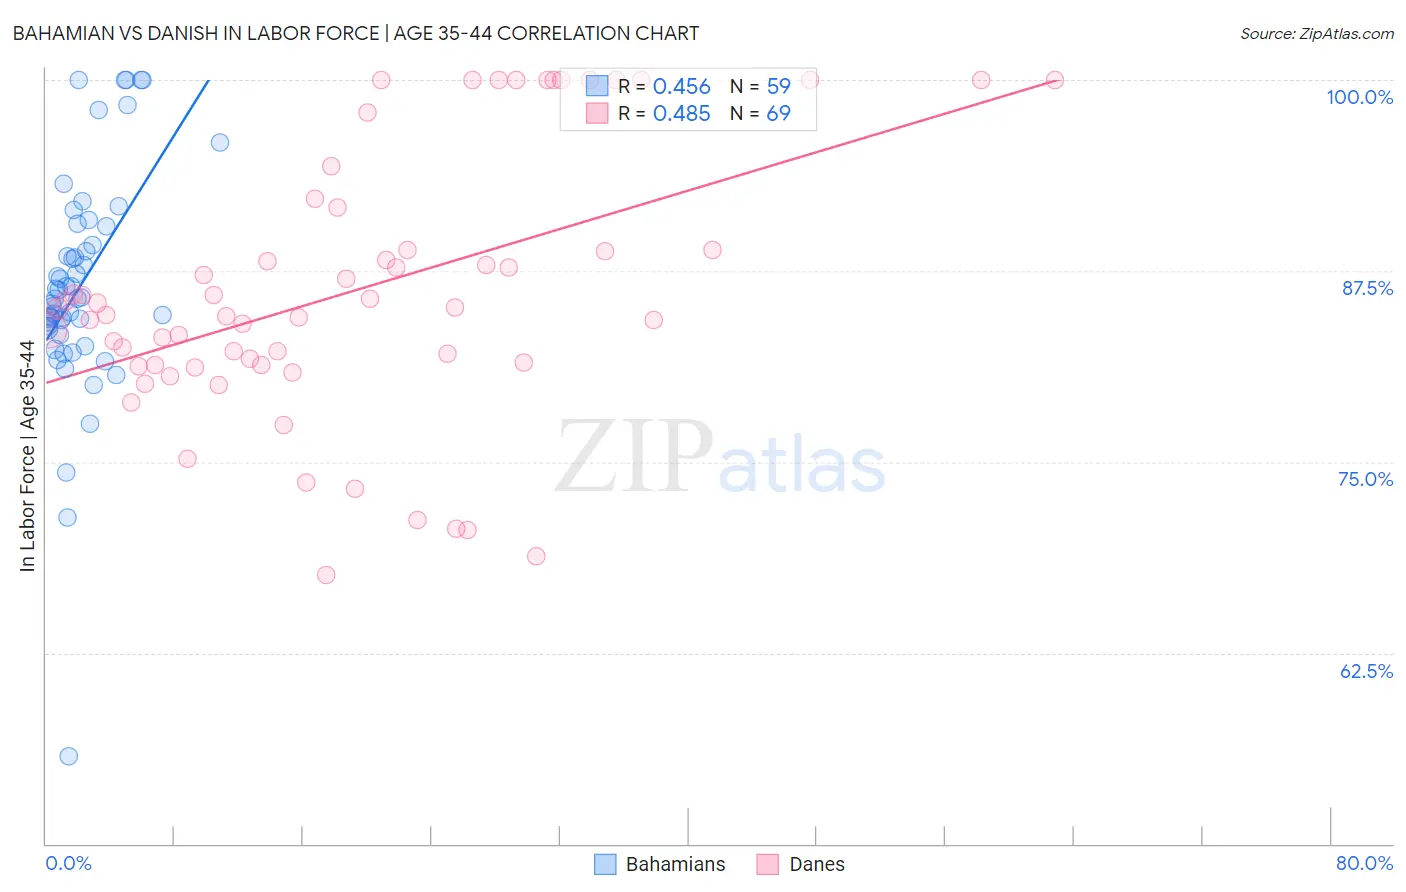
Bahamian vs Danish In Labor Force | Age 35-44 Correlation Chart
The statistical analysis conducted on geographies consisting of 112,616,837 people shows a moderate positive correlation between the proportion of Bahamians and labor force participation rate among population between the ages 35 and 44 in the United States with a correlation coefficient (R) of 0.456 and weighted average of 84.7%. Similarly, the statistical analysis conducted on geographies consisting of 473,902,315 people shows a moderate positive correlation between the proportion of Danes and labor force participation rate among population between the ages 35 and 44 in the United States with a correlation coefficient (R) of 0.485 and weighted average of 84.3%, a difference of 0.50%.
In Labor Force | Age 35-44 Correlation Summary
| Measurement | Bahamian | Danish |
| Minimum | 55.7% | 67.6% |
| Maximum | 100.0% | 100.0% |
| Range | 44.3% | 32.4% |
| Mean | 86.6% | 86.2% |
| Median | 85.7% | 85.0% |
| Interquartile 25% (IQ1) | 83.7% | 81.3% |
| Interquartile 75% (IQ3) | 90.4% | 90.3% |
| Interquartile Range (IQR) | 6.7% | 9.0% |
| Standard Deviation (Sample) | 7.4% | 8.7% |
| Standard Deviation (Population) | 7.3% | 8.6% |
Similar Demographics by In Labor Force | Age 35-44
Demographics Similar to Bahamians by In Labor Force | Age 35-44
In terms of in labor force | age 35-44, the demographic groups most similar to Bahamians are Immigrants from Western Africa (84.7%, a difference of 0.0%), Uruguayan (84.7%, a difference of 0.0%), Chilean (84.7%, a difference of 0.0%), Ukrainian (84.7%, a difference of 0.010%), and Immigrants from Egypt (84.7%, a difference of 0.010%).
| Demographics | Rating | Rank | In Labor Force | Age 35-44 |
| Immigrants | Argentina | 94.5 /100 | #108 | Exceptional 84.8% |
| Immigrants | Russia | 94.5 /100 | #109 | Exceptional 84.8% |
| Filipinos | 93.8 /100 | #110 | Exceptional 84.7% |
| Ukrainians | 93.5 /100 | #111 | Exceptional 84.7% |
| Immigrants | Western Africa | 93.4 /100 | #112 | Exceptional 84.7% |
| Uruguayans | 93.3 /100 | #113 | Exceptional 84.7% |
| Chileans | 93.2 /100 | #114 | Exceptional 84.7% |
| Bahamians | 93.2 /100 | #115 | Exceptional 84.7% |
| Immigrants | Egypt | 92.7 /100 | #116 | Exceptional 84.7% |
| Immigrants | China | 92.3 /100 | #117 | Exceptional 84.7% |
| Immigrants | Eastern Asia | 92.1 /100 | #118 | Exceptional 84.7% |
| Burmese | 91.8 /100 | #119 | Exceptional 84.7% |
| Immigrants | Northern Europe | 91.5 /100 | #120 | Exceptional 84.7% |
| Finns | 91.2 /100 | #121 | Exceptional 84.7% |
| Germans | 91.0 /100 | #122 | Exceptional 84.7% |
Demographics Similar to Danes by In Labor Force | Age 35-44
In terms of in labor force | age 35-44, the demographic groups most similar to Danes are Immigrants from West Indies (84.3%, a difference of 0.020%), Korean (84.3%, a difference of 0.020%), Barbadian (84.3%, a difference of 0.020%), Armenian (84.3%, a difference of 0.020%), and Costa Rican (84.3%, a difference of 0.020%).
| Demographics | Rating | Rank | In Labor Force | Age 35-44 |
| Immigrants | Trinidad and Tobago | 50.7 /100 | #173 | Average 84.4% |
| Immigrants | Iran | 50.0 /100 | #174 | Average 84.4% |
| Pakistanis | 48.2 /100 | #175 | Average 84.4% |
| Sri Lankans | 47.3 /100 | #176 | Average 84.4% |
| French Canadians | 44.3 /100 | #177 | Average 84.3% |
| Northern Europeans | 44.1 /100 | #178 | Average 84.3% |
| Immigrants | South Africa | 42.8 /100 | #179 | Average 84.3% |
| Danes | 38.8 /100 | #180 | Fair 84.3% |
| Immigrants | West Indies | 36.4 /100 | #181 | Fair 84.3% |
| Koreans | 36.3 /100 | #182 | Fair 84.3% |
| Barbadians | 36.2 /100 | #183 | Fair 84.3% |
| Armenians | 35.6 /100 | #184 | Fair 84.3% |
| Costa Ricans | 35.3 /100 | #185 | Fair 84.3% |
| Australians | 35.1 /100 | #186 | Fair 84.3% |
| Dutch | 34.8 /100 | #187 | Fair 84.3% |