Immigrants from Dominican Republic vs Danish In Labor Force | Age 35-44
COMPARE
Immigrants from Dominican Republic
Danish
In Labor Force | Age 35-44
In Labor Force | Age 35-44 Comparison
Immigrants from Dominican Republic
Danes
82.9%
IN LABOR FORCE | AGE 35-44
0.0/ 100
METRIC RATING
284th/ 347
METRIC RANK
84.3%
IN LABOR FORCE | AGE 35-44
38.8/ 100
METRIC RATING
180th/ 347
METRIC RANK
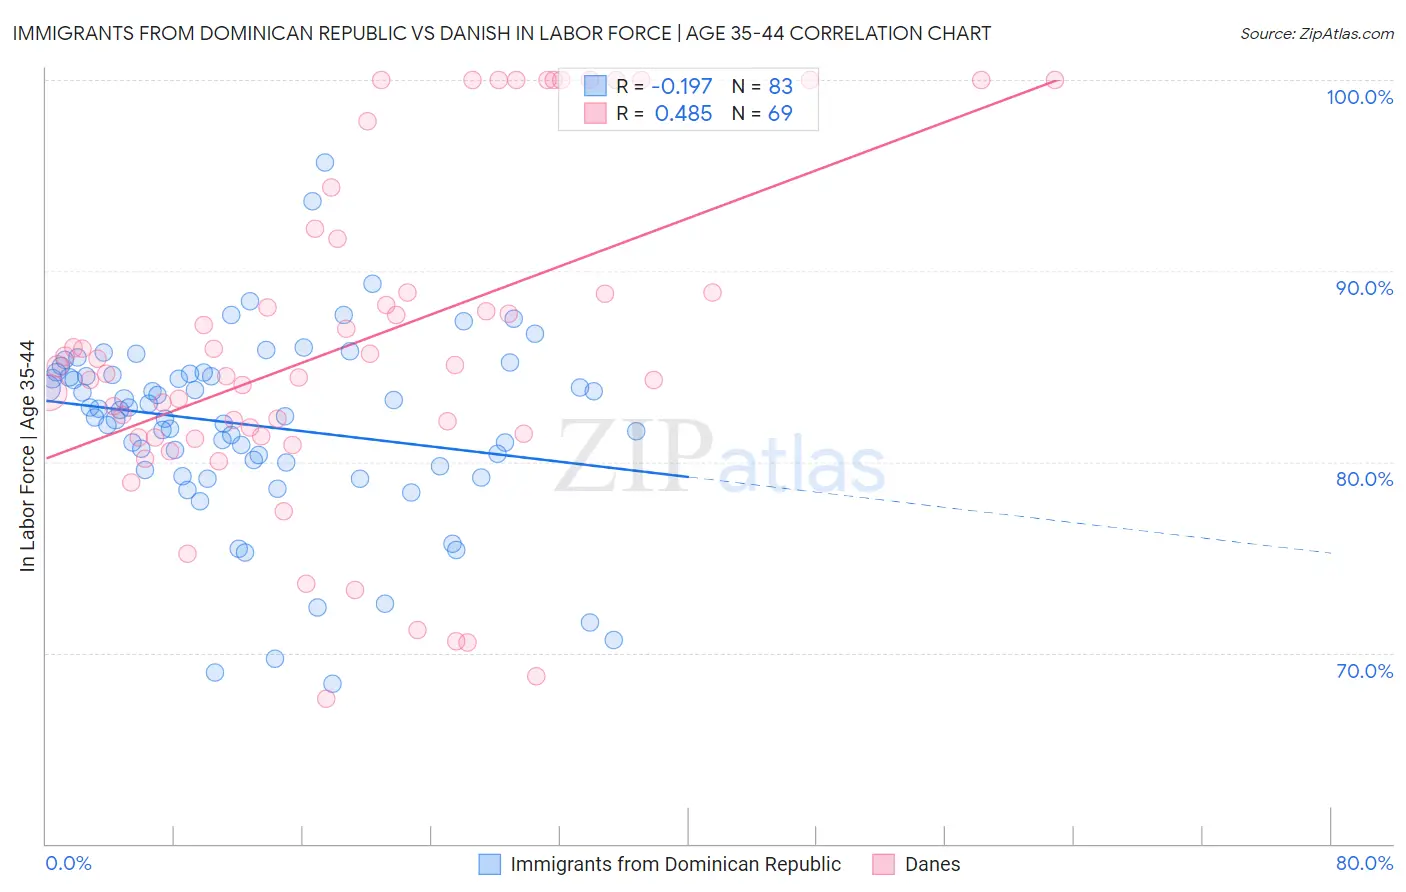
Immigrants from Dominican Republic vs Danish In Labor Force | Age 35-44 Correlation Chart
The statistical analysis conducted on geographies consisting of 275,005,604 people shows a poor negative correlation between the proportion of Immigrants from Dominican Republic and labor force participation rate among population between the ages 35 and 44 in the United States with a correlation coefficient (R) of -0.197 and weighted average of 82.9%. Similarly, the statistical analysis conducted on geographies consisting of 473,902,315 people shows a moderate positive correlation between the proportion of Danes and labor force participation rate among population between the ages 35 and 44 in the United States with a correlation coefficient (R) of 0.485 and weighted average of 84.3%, a difference of 1.6%.
In Labor Force | Age 35-44 Correlation Summary
| Measurement | Immigrants from Dominican Republic | Danish |
| Minimum | 68.4% | 67.6% |
| Maximum | 95.7% | 100.0% |
| Range | 27.3% | 32.4% |
| Mean | 81.9% | 86.2% |
| Median | 82.7% | 85.0% |
| Interquartile 25% (IQ1) | 79.8% | 81.3% |
| Interquartile 75% (IQ3) | 84.6% | 90.3% |
| Interquartile Range (IQR) | 4.9% | 9.0% |
| Standard Deviation (Sample) | 4.9% | 8.7% |
| Standard Deviation (Population) | 4.9% | 8.6% |
Similar Demographics by In Labor Force | Age 35-44
Demographics Similar to Immigrants from Dominican Republic by In Labor Force | Age 35-44
In terms of in labor force | age 35-44, the demographic groups most similar to Immigrants from Dominican Republic are Osage (82.9%, a difference of 0.010%), Immigrants from Guatemala (82.9%, a difference of 0.010%), Fijian (82.9%, a difference of 0.010%), Immigrants from Bangladesh (82.9%, a difference of 0.010%), and Immigrants from Belize (82.9%, a difference of 0.020%).
| Demographics | Rating | Rank | In Labor Force | Age 35-44 |
| Samoans | 0.0 /100 | #277 | Tragic 83.2% |
| Belizeans | 0.0 /100 | #278 | Tragic 83.1% |
| Immigrants | Micronesia | 0.0 /100 | #279 | Tragic 83.1% |
| Dominicans | 0.0 /100 | #280 | Tragic 83.1% |
| Guatemalans | 0.0 /100 | #281 | Tragic 83.0% |
| Osage | 0.0 /100 | #282 | Tragic 82.9% |
| Immigrants | Guatemala | 0.0 /100 | #283 | Tragic 82.9% |
| Immigrants | Dominican Republic | 0.0 /100 | #284 | Tragic 82.9% |
| Fijians | 0.0 /100 | #285 | Tragic 82.9% |
| Immigrants | Bangladesh | 0.0 /100 | #286 | Tragic 82.9% |
| Immigrants | Belize | 0.0 /100 | #287 | Tragic 82.9% |
| Puget Sound Salish | 0.0 /100 | #288 | Tragic 82.9% |
| Chippewa | 0.0 /100 | #289 | Tragic 82.9% |
| Africans | 0.0 /100 | #290 | Tragic 82.9% |
| Pennsylvania Germans | 0.0 /100 | #291 | Tragic 82.9% |
Demographics Similar to Danes by In Labor Force | Age 35-44
In terms of in labor force | age 35-44, the demographic groups most similar to Danes are Immigrants from West Indies (84.3%, a difference of 0.020%), Korean (84.3%, a difference of 0.020%), Barbadian (84.3%, a difference of 0.020%), Armenian (84.3%, a difference of 0.020%), and Costa Rican (84.3%, a difference of 0.020%).
| Demographics | Rating | Rank | In Labor Force | Age 35-44 |
| Immigrants | Trinidad and Tobago | 50.7 /100 | #173 | Average 84.4% |
| Immigrants | Iran | 50.0 /100 | #174 | Average 84.4% |
| Pakistanis | 48.2 /100 | #175 | Average 84.4% |
| Sri Lankans | 47.3 /100 | #176 | Average 84.4% |
| French Canadians | 44.3 /100 | #177 | Average 84.3% |
| Northern Europeans | 44.1 /100 | #178 | Average 84.3% |
| Immigrants | South Africa | 42.8 /100 | #179 | Average 84.3% |
| Danes | 38.8 /100 | #180 | Fair 84.3% |
| Immigrants | West Indies | 36.4 /100 | #181 | Fair 84.3% |
| Koreans | 36.3 /100 | #182 | Fair 84.3% |
| Barbadians | 36.2 /100 | #183 | Fair 84.3% |
| Armenians | 35.6 /100 | #184 | Fair 84.3% |
| Costa Ricans | 35.3 /100 | #185 | Fair 84.3% |
| Australians | 35.1 /100 | #186 | Fair 84.3% |
| Dutch | 34.8 /100 | #187 | Fair 84.3% |