Romanian vs Danish Householder Income Ages 45 - 64 years
COMPARE
Romanian
Danish
Householder Income Ages 45 - 64 years
Householder Income Ages 45 - 64 years Comparison
Romanians
Danes
$108,609
HOUSEHOLDER INCOME AGES 45 - 64 YEARS
98.5/ 100
METRIC RATING
88th/ 347
METRIC RANK
$105,619
HOUSEHOLDER INCOME AGES 45 - 64 YEARS
93.4/ 100
METRIC RATING
123rd/ 347
METRIC RANK
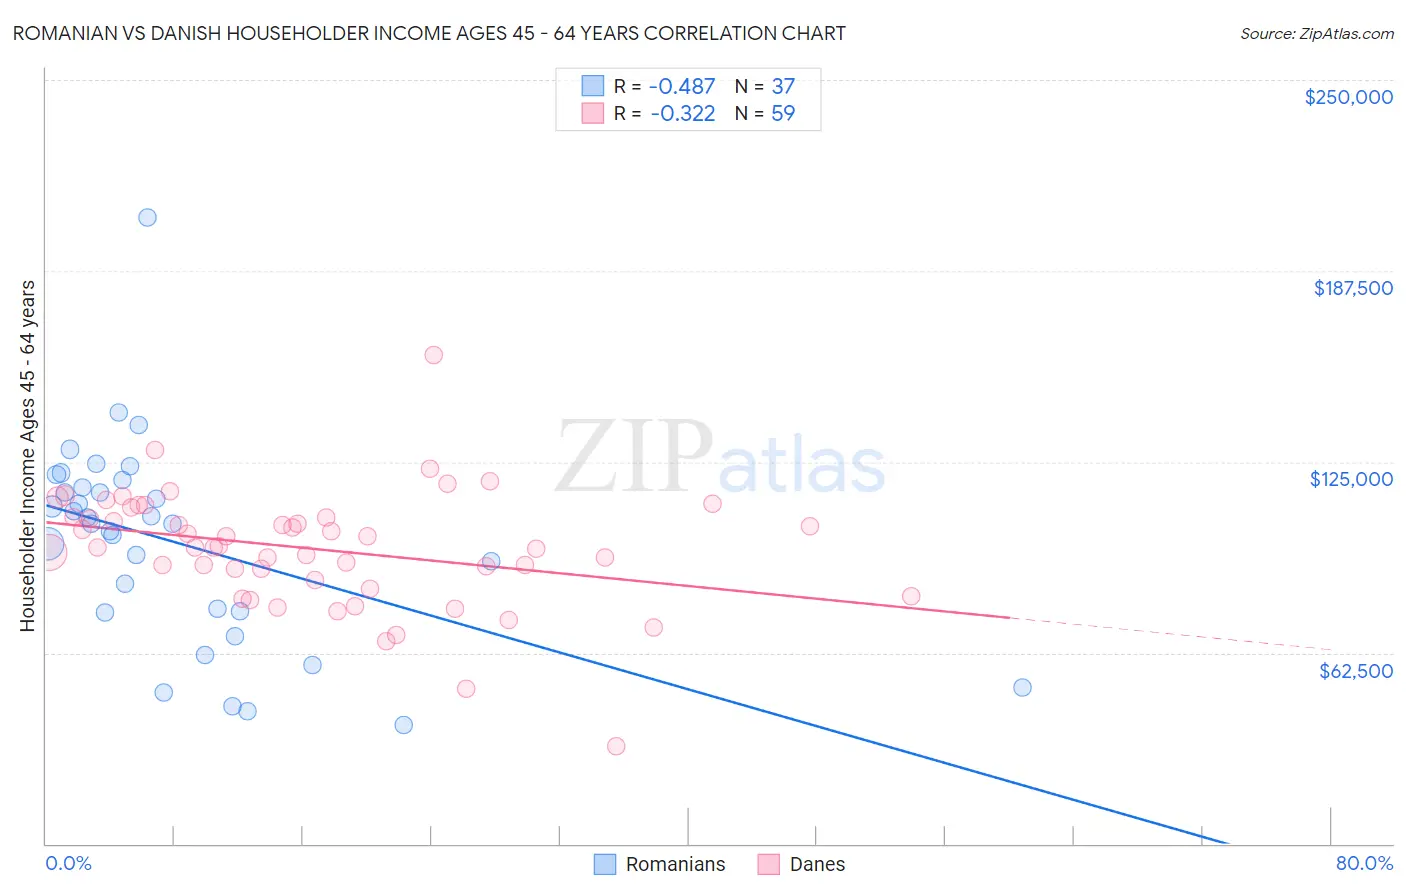
Romanian vs Danish Householder Income Ages 45 - 64 years Correlation Chart
The statistical analysis conducted on geographies consisting of 377,316,038 people shows a moderate negative correlation between the proportion of Romanians and household income with householder between the ages 45 and 64 in the United States with a correlation coefficient (R) of -0.487 and weighted average of $108,609. Similarly, the statistical analysis conducted on geographies consisting of 472,904,213 people shows a mild negative correlation between the proportion of Danes and household income with householder between the ages 45 and 64 in the United States with a correlation coefficient (R) of -0.322 and weighted average of $105,619, a difference of 2.8%.
Householder Income Ages 45 - 64 years Correlation Summary
| Measurement | Romanian | Danish |
| Minimum | $38,906 | $31,738 |
| Maximum | $205,179 | $159,821 |
| Range | $166,273 | $128,083 |
| Mean | $98,730 | $96,518 |
| Median | $104,735 | $97,157 |
| Interquartile 25% (IQ1) | $75,908 | $86,244 |
| Interquartile 75% (IQ3) | $117,732 | $106,951 |
| Interquartile Range (IQR) | $41,823 | $20,707 |
| Standard Deviation (Sample) | $33,257 | $19,437 |
| Standard Deviation (Population) | $32,804 | $19,272 |
Similar Demographics by Householder Income Ages 45 - 64 years
Demographics Similar to Romanians by Householder Income Ages 45 - 64 years
In terms of householder income ages 45 - 64 years, the demographic groups most similar to Romanians are Tongan ($108,643, a difference of 0.030%), Austrian ($108,692, a difference of 0.080%), Ukrainian ($108,475, a difference of 0.12%), Immigrants from Philippines ($108,471, a difference of 0.13%), and Immigrants from Lebanon ($108,471, a difference of 0.13%).
| Demographics | Rating | Rank | Householder Income Ages 45 - 64 years |
| Immigrants | Eastern Europe | 98.9 /100 | #81 | Exceptional $109,335 |
| Immigrants | North America | 98.8 /100 | #82 | Exceptional $109,198 |
| Immigrants | Spain | 98.8 /100 | #83 | Exceptional $109,051 |
| Immigrants | Western Europe | 98.6 /100 | #84 | Exceptional $108,824 |
| Immigrants | Afghanistan | 98.6 /100 | #85 | Exceptional $108,785 |
| Austrians | 98.5 /100 | #86 | Exceptional $108,692 |
| Tongans | 98.5 /100 | #87 | Exceptional $108,643 |
| Romanians | 98.5 /100 | #88 | Exceptional $108,609 |
| Ukrainians | 98.3 /100 | #89 | Exceptional $108,475 |
| Immigrants | Philippines | 98.3 /100 | #90 | Exceptional $108,471 |
| Immigrants | Lebanon | 98.3 /100 | #91 | Exceptional $108,471 |
| Croatians | 98.3 /100 | #92 | Exceptional $108,383 |
| Immigrants | Croatia | 98.2 /100 | #93 | Exceptional $108,304 |
| Sri Lankans | 98.2 /100 | #94 | Exceptional $108,270 |
| Immigrants | Hungary | 98.2 /100 | #95 | Exceptional $108,267 |
Demographics Similar to Danes by Householder Income Ages 45 - 64 years
In terms of householder income ages 45 - 64 years, the demographic groups most similar to Danes are Immigrants from Northern Africa ($105,430, a difference of 0.18%), Immigrants from North Macedonia ($105,892, a difference of 0.26%), Pakistani ($105,317, a difference of 0.29%), Portuguese ($105,309, a difference of 0.29%), and Polish ($105,952, a difference of 0.32%).
| Demographics | Rating | Rank | Householder Income Ages 45 - 64 years |
| British | 95.2 /100 | #116 | Exceptional $106,264 |
| Albanians | 95.1 /100 | #117 | Exceptional $106,243 |
| Immigrants | Western Asia | 95.0 /100 | #118 | Exceptional $106,217 |
| Immigrants | Jordan | 94.9 /100 | #119 | Exceptional $106,164 |
| Immigrants | South Eastern Asia | 94.8 /100 | #120 | Exceptional $106,109 |
| Poles | 94.4 /100 | #121 | Exceptional $105,952 |
| Immigrants | North Macedonia | 94.2 /100 | #122 | Exceptional $105,892 |
| Danes | 93.4 /100 | #123 | Exceptional $105,619 |
| Immigrants | Northern Africa | 92.8 /100 | #124 | Exceptional $105,430 |
| Pakistanis | 92.4 /100 | #125 | Exceptional $105,317 |
| Portuguese | 92.4 /100 | #126 | Exceptional $105,309 |
| Immigrants | Saudi Arabia | 92.2 /100 | #127 | Exceptional $105,249 |
| Native Hawaiians | 91.8 /100 | #128 | Exceptional $105,149 |
| Peruvians | 91.5 /100 | #129 | Exceptional $105,070 |
| Immigrants | Zimbabwe | 91.2 /100 | #130 | Exceptional $104,992 |