Romanian vs Danish Nursery School
COMPARE
Romanian
Danish
Nursery School
Nursery School Comparison
Romanians
Danes
98.3%
NURSERY SCHOOL
97.9/ 100
METRIC RATING
101st/ 347
METRIC RANK
98.6%
NURSERY SCHOOL
100.0/ 100
METRIC RATING
24th/ 347
METRIC RANK
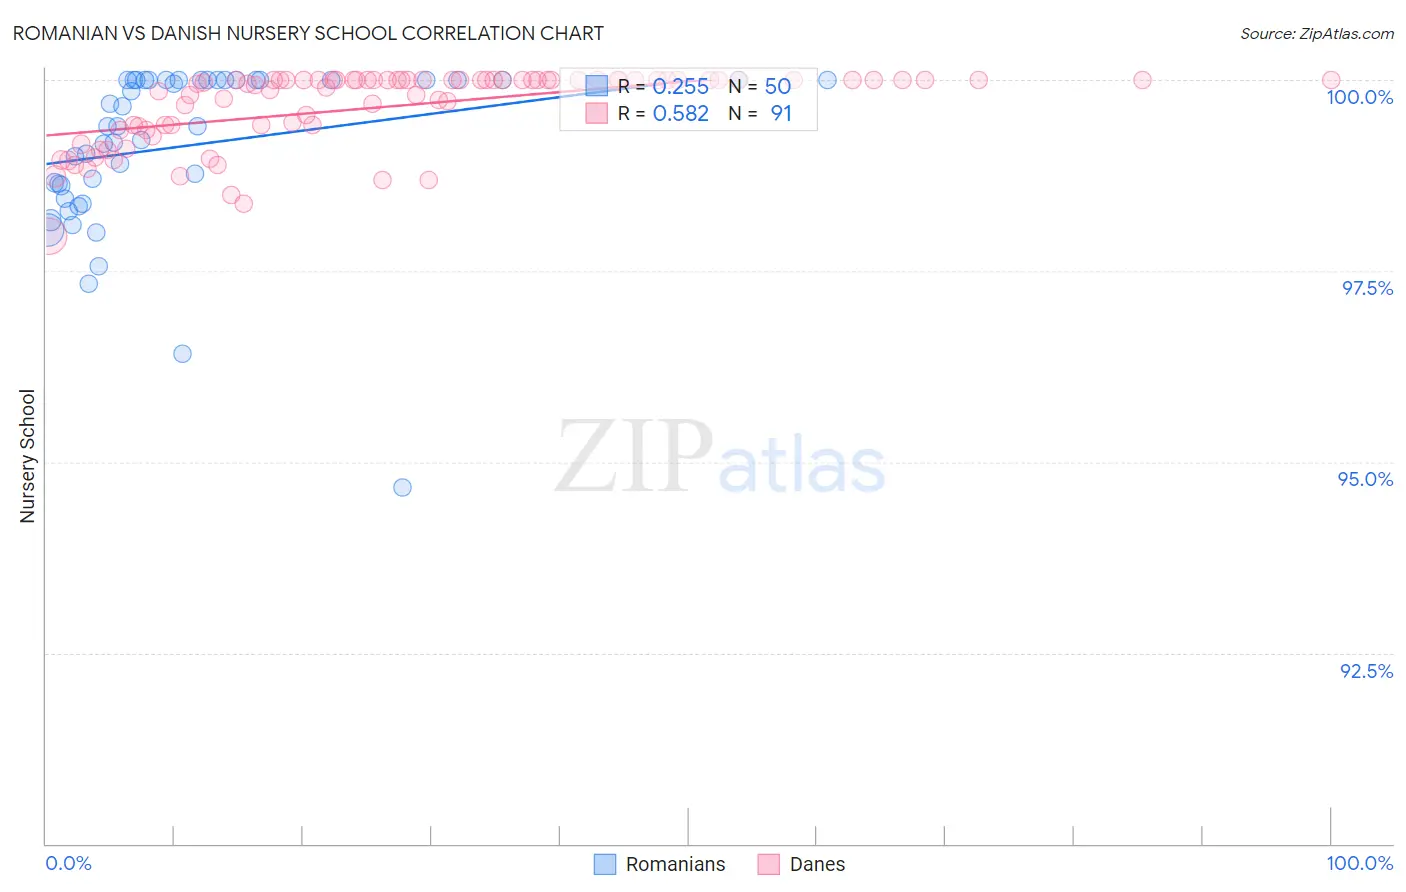
Romanian vs Danish Nursery School Correlation Chart
The statistical analysis conducted on geographies consisting of 377,904,438 people shows a weak positive correlation between the proportion of Romanians and percentage of population with at least nursery school education in the United States with a correlation coefficient (R) of 0.255 and weighted average of 98.3%. Similarly, the statistical analysis conducted on geographies consisting of 474,193,610 people shows a substantial positive correlation between the proportion of Danes and percentage of population with at least nursery school education in the United States with a correlation coefficient (R) of 0.582 and weighted average of 98.6%, a difference of 0.37%.
Nursery School Correlation Summary
| Measurement | Romanian | Danish |
| Minimum | 94.7% | 98.0% |
| Maximum | 100.0% | 100.0% |
| Range | 5.3% | 2.0% |
| Mean | 99.1% | 99.7% |
| Median | 99.4% | 100.0% |
| Interquartile 25% (IQ1) | 98.6% | 99.4% |
| Interquartile 75% (IQ3) | 100.0% | 100.0% |
| Interquartile Range (IQR) | 1.4% | 0.60% |
| Standard Deviation (Sample) | 1.1% | 0.49% |
| Standard Deviation (Population) | 1.1% | 0.49% |
Similar Demographics by Nursery School
Demographics Similar to Romanians by Nursery School
In terms of nursery school, the demographic groups most similar to Romanians are Puget Sound Salish (98.3%, a difference of 0.0%), Choctaw (98.3%, a difference of 0.010%), Colville (98.3%, a difference of 0.010%), Immigrants from Ireland (98.3%, a difference of 0.010%), and Cree (98.3%, a difference of 0.010%).
| Demographics | Rating | Rank | Nursery School |
| Immigrants | Germany | 98.6 /100 | #94 | Exceptional 98.3% |
| South Africans | 98.6 /100 | #95 | Exceptional 98.3% |
| Cypriots | 98.3 /100 | #96 | Exceptional 98.3% |
| Immigrants | Nonimmigrants | 98.3 /100 | #97 | Exceptional 98.3% |
| Choctaw | 98.3 /100 | #98 | Exceptional 98.3% |
| Colville | 98.2 /100 | #99 | Exceptional 98.3% |
| Puget Sound Salish | 98.0 /100 | #100 | Exceptional 98.3% |
| Romanians | 97.9 /100 | #101 | Exceptional 98.3% |
| Immigrants | Ireland | 97.7 /100 | #102 | Exceptional 98.3% |
| Cree | 97.7 /100 | #103 | Exceptional 98.3% |
| Bhutanese | 97.4 /100 | #104 | Exceptional 98.2% |
| Turks | 97.4 /100 | #105 | Exceptional 98.2% |
| Immigrants | Switzerland | 97.3 /100 | #106 | Exceptional 98.2% |
| Basques | 97.3 /100 | #107 | Exceptional 98.2% |
| Pima | 97.1 /100 | #108 | Exceptional 98.2% |
Demographics Similar to Danes by Nursery School
In terms of nursery school, the demographic groups most similar to Danes are Pennsylvania German (98.6%, a difference of 0.0%), Finnish (98.6%, a difference of 0.0%), Lithuanian (98.6%, a difference of 0.0%), Polish (98.6%, a difference of 0.0%), and Scotch-Irish (98.6%, a difference of 0.0%).
| Demographics | Rating | Rank | Nursery School |
| Aleuts | 100.0 /100 | #17 | Exceptional 98.7% |
| Dutch | 100.0 /100 | #18 | Exceptional 98.7% |
| Irish | 100.0 /100 | #19 | Exceptional 98.6% |
| Pennsylvania Germans | 100.0 /100 | #20 | Exceptional 98.6% |
| Finns | 100.0 /100 | #21 | Exceptional 98.6% |
| Lithuanians | 100.0 /100 | #22 | Exceptional 98.6% |
| Poles | 100.0 /100 | #23 | Exceptional 98.6% |
| Danes | 100.0 /100 | #24 | Exceptional 98.6% |
| Scotch-Irish | 100.0 /100 | #25 | Exceptional 98.6% |
| Sioux | 100.0 /100 | #26 | Exceptional 98.6% |
| Arapaho | 100.0 /100 | #27 | Exceptional 98.6% |
| Croatians | 100.0 /100 | #28 | Exceptional 98.6% |
| French | 100.0 /100 | #29 | Exceptional 98.6% |
| Europeans | 100.0 /100 | #30 | Exceptional 98.6% |
| Czechs | 100.0 /100 | #31 | Exceptional 98.6% |