Albanian vs Danish In Labor Force | Age 35-44
COMPARE
Albanian
Danish
In Labor Force | Age 35-44
In Labor Force | Age 35-44 Comparison
Albanians
Danes
85.1%
IN LABOR FORCE | AGE 35-44
99.4/ 100
METRIC RATING
60th/ 347
METRIC RANK
84.3%
IN LABOR FORCE | AGE 35-44
38.8/ 100
METRIC RATING
180th/ 347
METRIC RANK
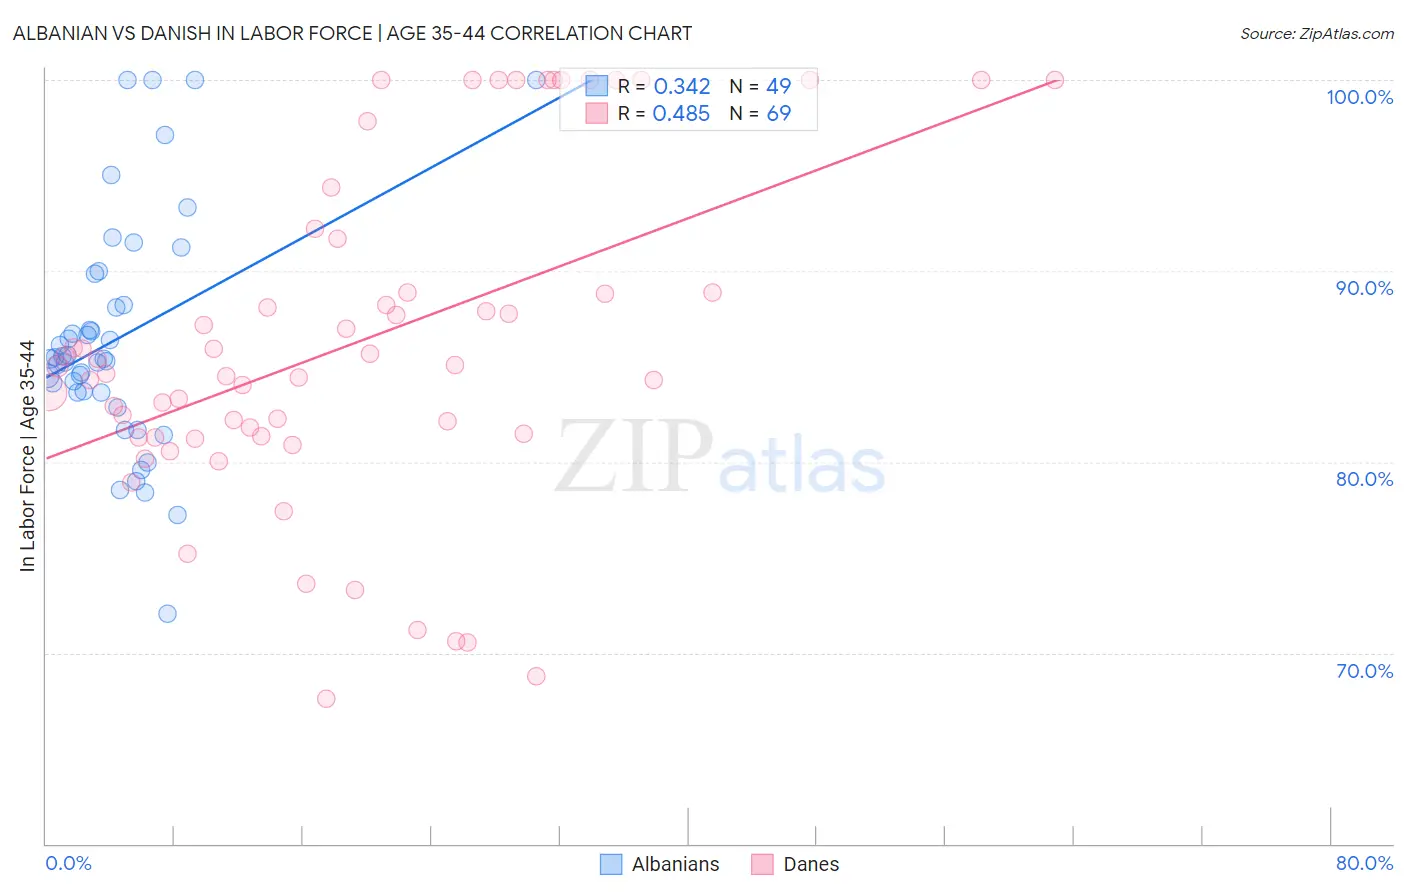
Albanian vs Danish In Labor Force | Age 35-44 Correlation Chart
The statistical analysis conducted on geographies consisting of 193,210,440 people shows a mild positive correlation between the proportion of Albanians and labor force participation rate among population between the ages 35 and 44 in the United States with a correlation coefficient (R) of 0.342 and weighted average of 85.1%. Similarly, the statistical analysis conducted on geographies consisting of 473,902,315 people shows a moderate positive correlation between the proportion of Danes and labor force participation rate among population between the ages 35 and 44 in the United States with a correlation coefficient (R) of 0.485 and weighted average of 84.3%, a difference of 0.90%.
In Labor Force | Age 35-44 Correlation Summary
| Measurement | Albanian | Danish |
| Minimum | 72.1% | 67.6% |
| Maximum | 100.0% | 100.0% |
| Range | 27.9% | 32.4% |
| Mean | 86.4% | 86.2% |
| Median | 85.4% | 85.0% |
| Interquartile 25% (IQ1) | 83.6% | 81.3% |
| Interquartile 75% (IQ3) | 89.0% | 90.3% |
| Interquartile Range (IQR) | 5.4% | 9.0% |
| Standard Deviation (Sample) | 6.1% | 8.7% |
| Standard Deviation (Population) | 6.0% | 8.6% |
Similar Demographics by In Labor Force | Age 35-44
Demographics Similar to Albanians by In Labor Force | Age 35-44
In terms of in labor force | age 35-44, the demographic groups most similar to Albanians are Serbian (85.1%, a difference of 0.0%), Chinese (85.1%, a difference of 0.010%), Slovak (85.1%, a difference of 0.010%), Immigrants from Latvia (85.0%, a difference of 0.020%), and Immigrants from Moldova (85.0%, a difference of 0.020%).
| Demographics | Rating | Rank | In Labor Force | Age 35-44 |
| Taiwanese | 99.6 /100 | #53 | Exceptional 85.1% |
| Turks | 99.5 /100 | #54 | Exceptional 85.1% |
| Soviet Union | 99.5 /100 | #55 | Exceptional 85.1% |
| Immigrants | Croatia | 99.5 /100 | #56 | Exceptional 85.1% |
| Chinese | 99.4 /100 | #57 | Exceptional 85.1% |
| Slovaks | 99.4 /100 | #58 | Exceptional 85.1% |
| Serbians | 99.4 /100 | #59 | Exceptional 85.1% |
| Albanians | 99.4 /100 | #60 | Exceptional 85.1% |
| Immigrants | Latvia | 99.3 /100 | #61 | Exceptional 85.0% |
| Immigrants | Moldova | 99.3 /100 | #62 | Exceptional 85.0% |
| Immigrants | Uganda | 99.3 /100 | #63 | Exceptional 85.0% |
| Swedes | 99.2 /100 | #64 | Exceptional 85.0% |
| Immigrants | Brazil | 99.2 /100 | #65 | Exceptional 85.0% |
| Immigrants | Haiti | 99.1 /100 | #66 | Exceptional 85.0% |
| Immigrants | Italy | 99.1 /100 | #67 | Exceptional 85.0% |
Demographics Similar to Danes by In Labor Force | Age 35-44
In terms of in labor force | age 35-44, the demographic groups most similar to Danes are Immigrants from West Indies (84.3%, a difference of 0.020%), Korean (84.3%, a difference of 0.020%), Barbadian (84.3%, a difference of 0.020%), Armenian (84.3%, a difference of 0.020%), and Costa Rican (84.3%, a difference of 0.020%).
| Demographics | Rating | Rank | In Labor Force | Age 35-44 |
| Immigrants | Trinidad and Tobago | 50.7 /100 | #173 | Average 84.4% |
| Immigrants | Iran | 50.0 /100 | #174 | Average 84.4% |
| Pakistanis | 48.2 /100 | #175 | Average 84.4% |
| Sri Lankans | 47.3 /100 | #176 | Average 84.4% |
| French Canadians | 44.3 /100 | #177 | Average 84.3% |
| Northern Europeans | 44.1 /100 | #178 | Average 84.3% |
| Immigrants | South Africa | 42.8 /100 | #179 | Average 84.3% |
| Danes | 38.8 /100 | #180 | Fair 84.3% |
| Immigrants | West Indies | 36.4 /100 | #181 | Fair 84.3% |
| Koreans | 36.3 /100 | #182 | Fair 84.3% |
| Barbadians | 36.2 /100 | #183 | Fair 84.3% |
| Armenians | 35.6 /100 | #184 | Fair 84.3% |
| Costa Ricans | 35.3 /100 | #185 | Fair 84.3% |
| Australians | 35.1 /100 | #186 | Fair 84.3% |
| Dutch | 34.8 /100 | #187 | Fair 84.3% |