Puget Sound Salish vs Yugoslavian In Labor Force | Age 25-29
COMPARE
Puget Sound Salish
Yugoslavian
In Labor Force | Age 25-29
In Labor Force | Age 25-29 Comparison
Puget Sound Salish
Yugoslavians
83.5%
IN LABOR FORCE | AGE 25-29
0.1/ 100
METRIC RATING
264th/ 347
METRIC RANK
85.6%
IN LABOR FORCE | AGE 25-29
99.8/ 100
METRIC RATING
50th/ 347
METRIC RANK
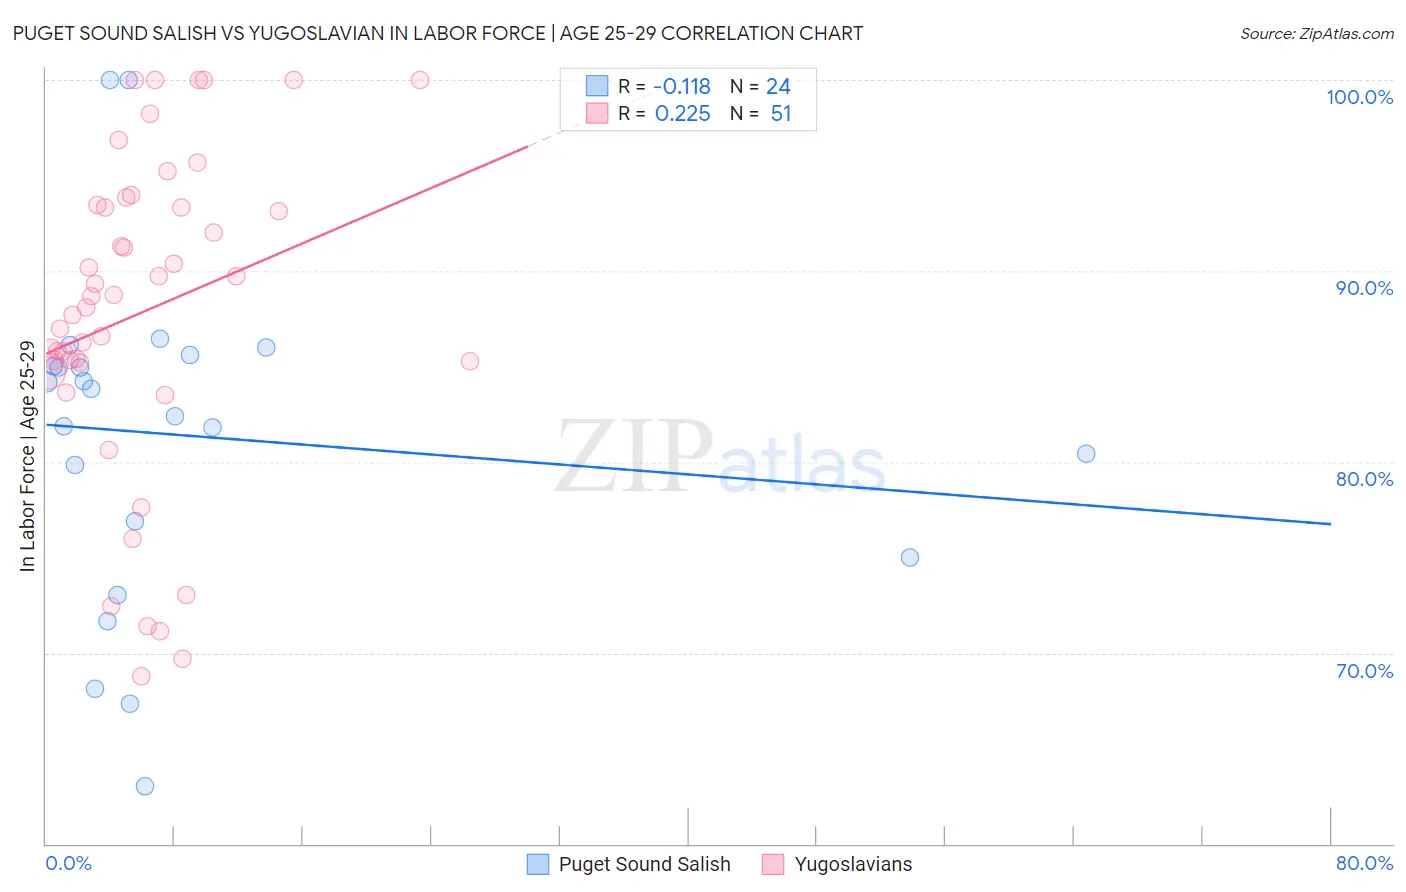
Puget Sound Salish vs Yugoslavian In Labor Force | Age 25-29 Correlation Chart
The statistical analysis conducted on geographies consisting of 46,150,488 people shows a poor negative correlation between the proportion of Puget Sound Salish and labor force participation rate among population between the ages 25 and 29 in the United States with a correlation coefficient (R) of -0.118 and weighted average of 83.5%. Similarly, the statistical analysis conducted on geographies consisting of 285,642,405 people shows a weak positive correlation between the proportion of Yugoslavians and labor force participation rate among population between the ages 25 and 29 in the United States with a correlation coefficient (R) of 0.225 and weighted average of 85.6%, a difference of 2.5%.
In Labor Force | Age 25-29 Correlation Summary
| Measurement | Puget Sound Salish | Yugoslavian |
| Minimum | 63.0% | 68.8% |
| Maximum | 100.0% | 100.0% |
| Range | 37.0% | 31.2% |
| Mean | 81.4% | 87.9% |
| Median | 83.1% | 88.7% |
| Interquartile 25% (IQ1) | 76.0% | 85.2% |
| Interquartile 75% (IQ3) | 85.3% | 93.5% |
| Interquartile Range (IQR) | 9.4% | 8.3% |
| Standard Deviation (Sample) | 8.8% | 8.4% |
| Standard Deviation (Population) | 8.6% | 8.3% |
Similar Demographics by In Labor Force | Age 25-29
Demographics Similar to Puget Sound Salish by In Labor Force | Age 25-29
In terms of in labor force | age 25-29, the demographic groups most similar to Puget Sound Salish are Cuban (83.5%, a difference of 0.0%), Aleut (83.4%, a difference of 0.040%), Spanish American (83.4%, a difference of 0.050%), West Indian (83.5%, a difference of 0.060%), and Immigrants from Lebanon (83.4%, a difference of 0.060%).
| Demographics | Rating | Rank | In Labor Force | Age 25-29 |
| Delaware | 0.2 /100 | #257 | Tragic 83.7% |
| Immigrants | Guatemala | 0.1 /100 | #258 | Tragic 83.6% |
| Spanish | 0.1 /100 | #259 | Tragic 83.6% |
| Immigrants | Bahamas | 0.1 /100 | #260 | Tragic 83.6% |
| Pennsylvania Germans | 0.1 /100 | #261 | Tragic 83.6% |
| Immigrants | Fiji | 0.1 /100 | #262 | Tragic 83.6% |
| West Indians | 0.1 /100 | #263 | Tragic 83.5% |
| Puget Sound Salish | 0.1 /100 | #264 | Tragic 83.5% |
| Cubans | 0.1 /100 | #265 | Tragic 83.5% |
| Aleuts | 0.0 /100 | #266 | Tragic 83.4% |
| Spanish Americans | 0.0 /100 | #267 | Tragic 83.4% |
| Immigrants | Lebanon | 0.0 /100 | #268 | Tragic 83.4% |
| Immigrants | Barbados | 0.0 /100 | #269 | Tragic 83.4% |
| Basques | 0.0 /100 | #270 | Tragic 83.4% |
| Hondurans | 0.0 /100 | #271 | Tragic 83.4% |
Demographics Similar to Yugoslavians by In Labor Force | Age 25-29
In terms of in labor force | age 25-29, the demographic groups most similar to Yugoslavians are Immigrants from Latvia (85.6%, a difference of 0.0%), Swedish (85.6%, a difference of 0.030%), Immigrants from Poland (85.6%, a difference of 0.030%), Turkish (85.6%, a difference of 0.040%), and Italian (85.6%, a difference of 0.040%).
| Demographics | Rating | Rank | In Labor Force | Age 25-29 |
| Immigrants | India | 99.9 /100 | #43 | Exceptional 85.7% |
| Macedonians | 99.9 /100 | #44 | Exceptional 85.7% |
| Immigrants | Sierra Leone | 99.9 /100 | #45 | Exceptional 85.7% |
| Czechs | 99.8 /100 | #46 | Exceptional 85.6% |
| Turks | 99.8 /100 | #47 | Exceptional 85.6% |
| Italians | 99.8 /100 | #48 | Exceptional 85.6% |
| Swedes | 99.8 /100 | #49 | Exceptional 85.6% |
| Yugoslavians | 99.8 /100 | #50 | Exceptional 85.6% |
| Immigrants | Latvia | 99.8 /100 | #51 | Exceptional 85.6% |
| Immigrants | Poland | 99.7 /100 | #52 | Exceptional 85.6% |
| Belgians | 99.7 /100 | #53 | Exceptional 85.5% |
| Albanians | 99.7 /100 | #54 | Exceptional 85.5% |
| Immigrants | Brazil | 99.7 /100 | #55 | Exceptional 85.5% |
| Eastern Europeans | 99.6 /100 | #56 | Exceptional 85.5% |
| Estonians | 99.6 /100 | #57 | Exceptional 85.5% |