Puget Sound Salish vs Immigrants from Thailand In Labor Force | Age 25-29
COMPARE
Puget Sound Salish
Immigrants from Thailand
In Labor Force | Age 25-29
In Labor Force | Age 25-29 Comparison
Puget Sound Salish
Immigrants from Thailand
83.5%
IN LABOR FORCE | AGE 25-29
0.1/ 100
METRIC RATING
264th/ 347
METRIC RANK
84.6%
IN LABOR FORCE | AGE 25-29
45.2/ 100
METRIC RATING
178th/ 347
METRIC RANK
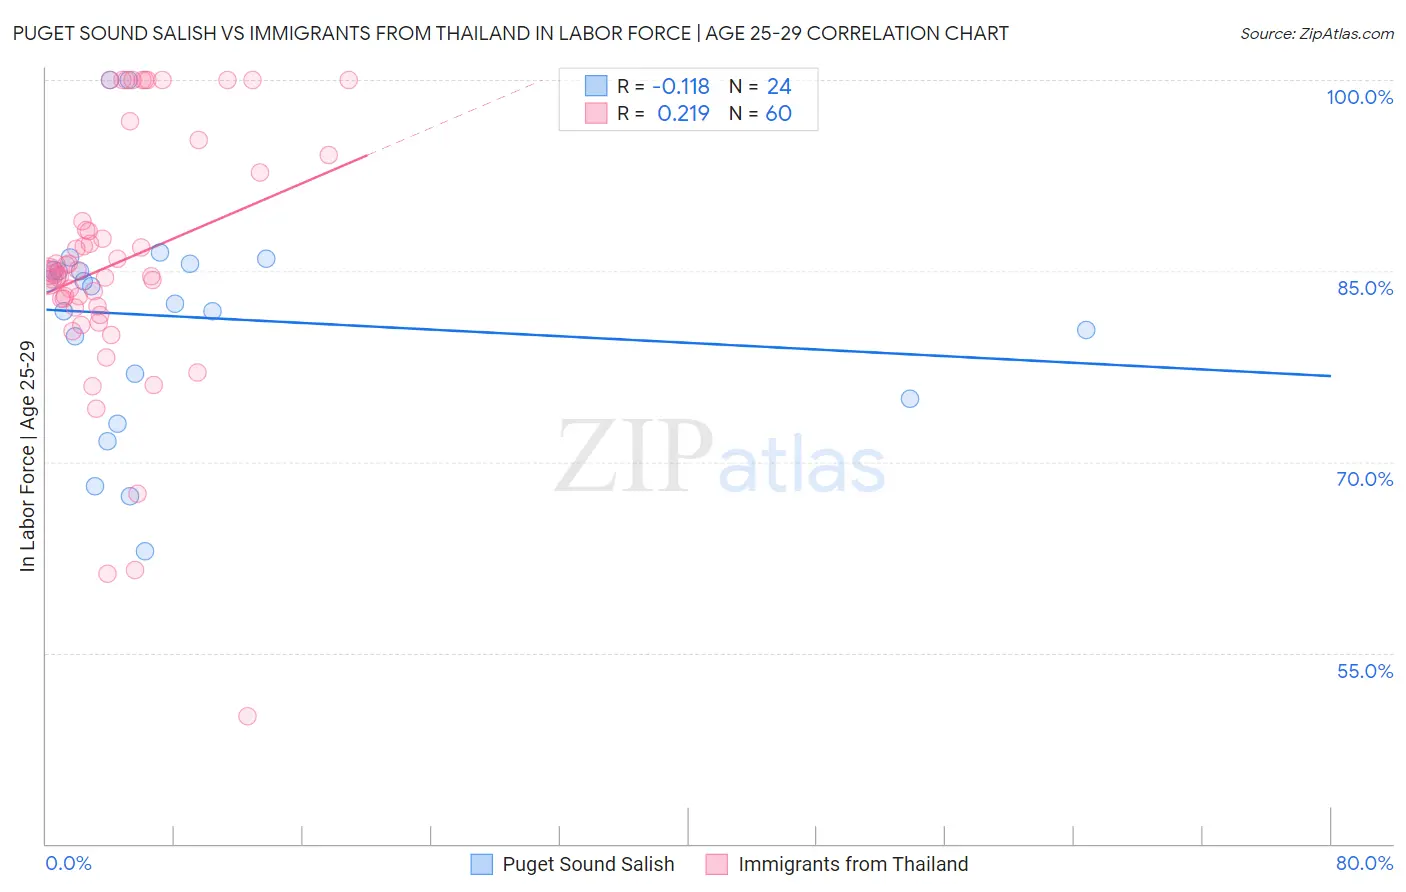
Puget Sound Salish vs Immigrants from Thailand In Labor Force | Age 25-29 Correlation Chart
The statistical analysis conducted on geographies consisting of 46,150,488 people shows a poor negative correlation between the proportion of Puget Sound Salish and labor force participation rate among population between the ages 25 and 29 in the United States with a correlation coefficient (R) of -0.118 and weighted average of 83.5%. Similarly, the statistical analysis conducted on geographies consisting of 316,978,780 people shows a weak positive correlation between the proportion of Immigrants from Thailand and labor force participation rate among population between the ages 25 and 29 in the United States with a correlation coefficient (R) of 0.219 and weighted average of 84.6%, a difference of 1.4%.
In Labor Force | Age 25-29 Correlation Summary
| Measurement | Puget Sound Salish | Immigrants from Thailand |
| Minimum | 63.0% | 50.0% |
| Maximum | 100.0% | 100.0% |
| Range | 37.0% | 50.0% |
| Mean | 81.4% | 85.7% |
| Median | 83.1% | 84.8% |
| Interquartile 25% (IQ1) | 76.0% | 82.2% |
| Interquartile 75% (IQ3) | 85.3% | 90.8% |
| Interquartile Range (IQR) | 9.4% | 8.6% |
| Standard Deviation (Sample) | 8.8% | 10.1% |
| Standard Deviation (Population) | 8.6% | 10.1% |
Similar Demographics by In Labor Force | Age 25-29
Demographics Similar to Puget Sound Salish by In Labor Force | Age 25-29
In terms of in labor force | age 25-29, the demographic groups most similar to Puget Sound Salish are Cuban (83.5%, a difference of 0.0%), Aleut (83.4%, a difference of 0.040%), Spanish American (83.4%, a difference of 0.050%), West Indian (83.5%, a difference of 0.060%), and Immigrants from Lebanon (83.4%, a difference of 0.060%).
| Demographics | Rating | Rank | In Labor Force | Age 25-29 |
| Delaware | 0.2 /100 | #257 | Tragic 83.7% |
| Immigrants | Guatemala | 0.1 /100 | #258 | Tragic 83.6% |
| Spanish | 0.1 /100 | #259 | Tragic 83.6% |
| Immigrants | Bahamas | 0.1 /100 | #260 | Tragic 83.6% |
| Pennsylvania Germans | 0.1 /100 | #261 | Tragic 83.6% |
| Immigrants | Fiji | 0.1 /100 | #262 | Tragic 83.6% |
| West Indians | 0.1 /100 | #263 | Tragic 83.5% |
| Puget Sound Salish | 0.1 /100 | #264 | Tragic 83.5% |
| Cubans | 0.1 /100 | #265 | Tragic 83.5% |
| Aleuts | 0.0 /100 | #266 | Tragic 83.4% |
| Spanish Americans | 0.0 /100 | #267 | Tragic 83.4% |
| Immigrants | Lebanon | 0.0 /100 | #268 | Tragic 83.4% |
| Immigrants | Barbados | 0.0 /100 | #269 | Tragic 83.4% |
| Basques | 0.0 /100 | #270 | Tragic 83.4% |
| Hondurans | 0.0 /100 | #271 | Tragic 83.4% |
Demographics Similar to Immigrants from Thailand by In Labor Force | Age 25-29
In terms of in labor force | age 25-29, the demographic groups most similar to Immigrants from Thailand are Immigrants from China (84.6%, a difference of 0.0%), Malaysian (84.6%, a difference of 0.010%), Immigrants from Argentina (84.6%, a difference of 0.010%), Hungarian (84.6%, a difference of 0.020%), and Immigrants from South America (84.6%, a difference of 0.020%).
| Demographics | Rating | Rank | In Labor Force | Age 25-29 |
| Immigrants | Vietnam | 50.5 /100 | #171 | Average 84.7% |
| Immigrants | Western Europe | 50.4 /100 | #172 | Average 84.7% |
| Assyrians/Chaldeans/Syriacs | 50.2 /100 | #173 | Average 84.7% |
| Palestinians | 50.0 /100 | #174 | Average 84.7% |
| Hungarians | 47.8 /100 | #175 | Average 84.6% |
| Malaysians | 46.8 /100 | #176 | Average 84.6% |
| Immigrants | China | 45.7 /100 | #177 | Average 84.6% |
| Immigrants | Thailand | 45.2 /100 | #178 | Average 84.6% |
| Immigrants | Argentina | 44.0 /100 | #179 | Average 84.6% |
| Immigrants | South America | 42.9 /100 | #180 | Average 84.6% |
| Immigrants | Norway | 41.9 /100 | #181 | Average 84.6% |
| Europeans | 40.3 /100 | #182 | Average 84.6% |
| Scottish | 40.1 /100 | #183 | Average 84.6% |
| Immigrants | Kuwait | 38.2 /100 | #184 | Fair 84.6% |
| Immigrants | Denmark | 37.0 /100 | #185 | Fair 84.6% |