Puget Sound Salish vs Immigrants from Iraq In Labor Force | Age 25-29
COMPARE
Puget Sound Salish
Immigrants from Iraq
In Labor Force | Age 25-29
In Labor Force | Age 25-29 Comparison
Puget Sound Salish
Immigrants from Iraq
83.5%
IN LABOR FORCE | AGE 25-29
0.1/ 100
METRIC RATING
264th/ 347
METRIC RANK
84.4%
IN LABOR FORCE | AGE 25-29
19.0/ 100
METRIC RATING
198th/ 347
METRIC RANK
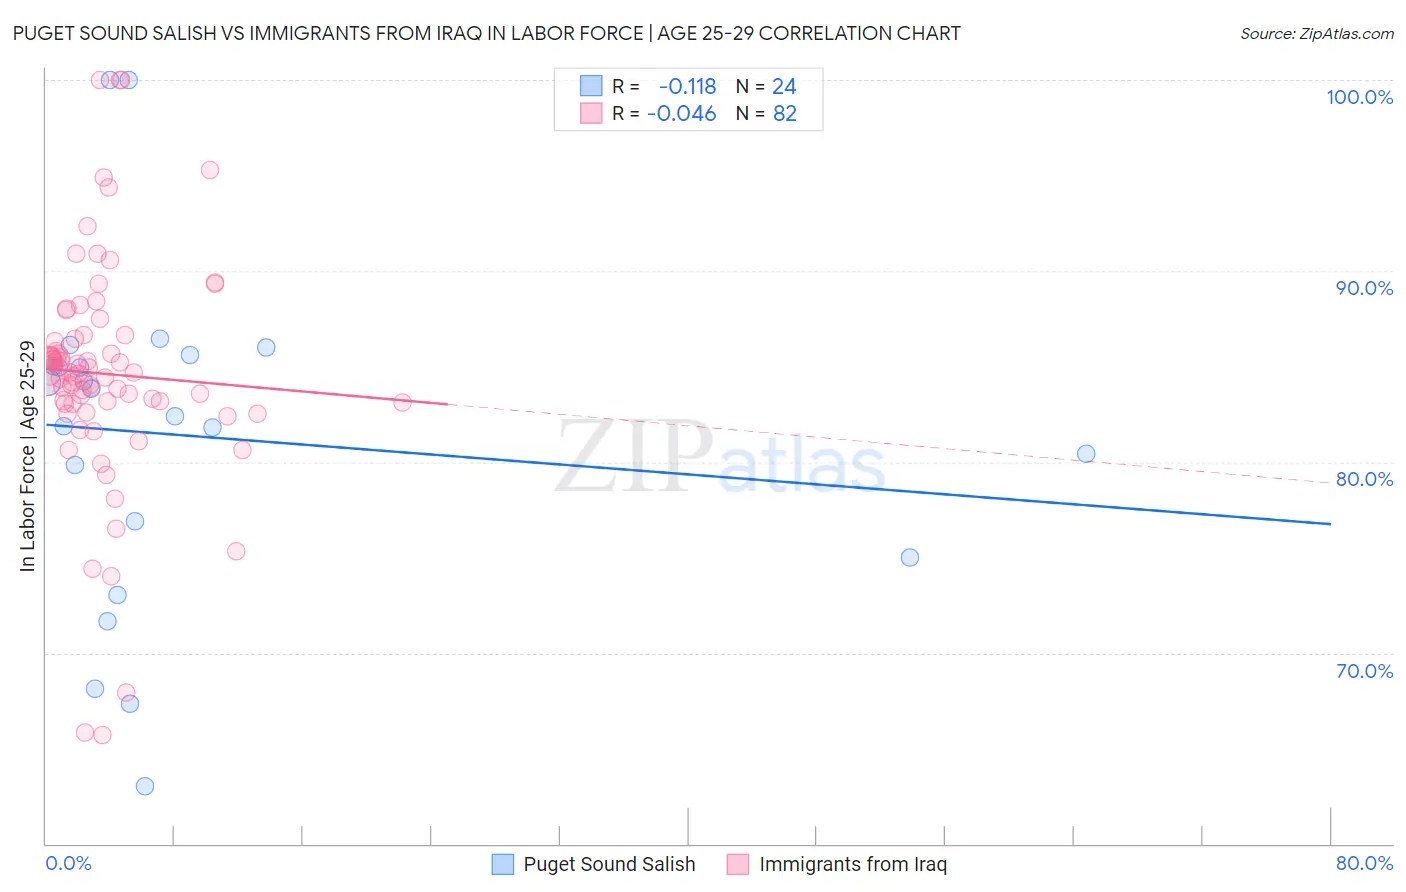
Puget Sound Salish vs Immigrants from Iraq In Labor Force | Age 25-29 Correlation Chart
The statistical analysis conducted on geographies consisting of 46,150,488 people shows a poor negative correlation between the proportion of Puget Sound Salish and labor force participation rate among population between the ages 25 and 29 in the United States with a correlation coefficient (R) of -0.118 and weighted average of 83.5%. Similarly, the statistical analysis conducted on geographies consisting of 194,759,313 people shows no correlation between the proportion of Immigrants from Iraq and labor force participation rate among population between the ages 25 and 29 in the United States with a correlation coefficient (R) of -0.046 and weighted average of 84.4%, a difference of 1.1%.
In Labor Force | Age 25-29 Correlation Summary
| Measurement | Puget Sound Salish | Immigrants from Iraq |
| Minimum | 63.0% | 65.7% |
| Maximum | 100.0% | 100.0% |
| Range | 37.0% | 34.3% |
| Mean | 81.4% | 84.6% |
| Median | 83.1% | 84.6% |
| Interquartile 25% (IQ1) | 76.0% | 83.0% |
| Interquartile 75% (IQ3) | 85.3% | 86.4% |
| Interquartile Range (IQR) | 9.4% | 3.4% |
| Standard Deviation (Sample) | 8.8% | 6.0% |
| Standard Deviation (Population) | 8.6% | 5.9% |
Similar Demographics by In Labor Force | Age 25-29
Demographics Similar to Puget Sound Salish by In Labor Force | Age 25-29
In terms of in labor force | age 25-29, the demographic groups most similar to Puget Sound Salish are Cuban (83.5%, a difference of 0.0%), Aleut (83.4%, a difference of 0.040%), Spanish American (83.4%, a difference of 0.050%), West Indian (83.5%, a difference of 0.060%), and Immigrants from Lebanon (83.4%, a difference of 0.060%).
| Demographics | Rating | Rank | In Labor Force | Age 25-29 |
| Delaware | 0.2 /100 | #257 | Tragic 83.7% |
| Immigrants | Guatemala | 0.1 /100 | #258 | Tragic 83.6% |
| Spanish | 0.1 /100 | #259 | Tragic 83.6% |
| Immigrants | Bahamas | 0.1 /100 | #260 | Tragic 83.6% |
| Pennsylvania Germans | 0.1 /100 | #261 | Tragic 83.6% |
| Immigrants | Fiji | 0.1 /100 | #262 | Tragic 83.6% |
| West Indians | 0.1 /100 | #263 | Tragic 83.5% |
| Puget Sound Salish | 0.1 /100 | #264 | Tragic 83.5% |
| Cubans | 0.1 /100 | #265 | Tragic 83.5% |
| Aleuts | 0.0 /100 | #266 | Tragic 83.4% |
| Spanish Americans | 0.0 /100 | #267 | Tragic 83.4% |
| Immigrants | Lebanon | 0.0 /100 | #268 | Tragic 83.4% |
| Immigrants | Barbados | 0.0 /100 | #269 | Tragic 83.4% |
| Basques | 0.0 /100 | #270 | Tragic 83.4% |
| Hondurans | 0.0 /100 | #271 | Tragic 83.4% |
Demographics Similar to Immigrants from Iraq by In Labor Force | Age 25-29
In terms of in labor force | age 25-29, the demographic groups most similar to Immigrants from Iraq are Tlingit-Haida (84.4%, a difference of 0.0%), Immigrants from South Eastern Asia (84.4%, a difference of 0.010%), Immigrants from Germany (84.4%, a difference of 0.010%), Immigrants from Israel (84.4%, a difference of 0.020%), and Immigrants from Kazakhstan (84.4%, a difference of 0.020%).
| Demographics | Rating | Rank | In Labor Force | Age 25-29 |
| Zimbabweans | 28.7 /100 | #191 | Fair 84.5% |
| English | 25.8 /100 | #192 | Fair 84.5% |
| South American Indians | 25.0 /100 | #193 | Fair 84.5% |
| Portuguese | 21.2 /100 | #194 | Fair 84.4% |
| Immigrants | Israel | 20.8 /100 | #195 | Fair 84.4% |
| Immigrants | South Eastern Asia | 19.5 /100 | #196 | Poor 84.4% |
| Tlingit-Haida | 19.3 /100 | #197 | Poor 84.4% |
| Immigrants | Iraq | 19.0 /100 | #198 | Poor 84.4% |
| Immigrants | Germany | 18.3 /100 | #199 | Poor 84.4% |
| Immigrants | Kazakhstan | 17.5 /100 | #200 | Poor 84.4% |
| Laotians | 16.6 /100 | #201 | Poor 84.4% |
| Afghans | 15.9 /100 | #202 | Poor 84.4% |
| Immigrants | Afghanistan | 15.6 /100 | #203 | Poor 84.4% |
| Venezuelans | 15.1 /100 | #204 | Poor 84.4% |
| Ecuadorians | 14.8 /100 | #205 | Poor 84.4% |