New Zealander vs Yugoslavian In Labor Force | Age 25-29
COMPARE
New Zealander
Yugoslavian
In Labor Force | Age 25-29
In Labor Force | Age 25-29 Comparison
New Zealanders
Yugoslavians
85.0%
IN LABOR FORCE | AGE 25-29
91.5/ 100
METRIC RATING
110th/ 347
METRIC RANK
85.6%
IN LABOR FORCE | AGE 25-29
99.8/ 100
METRIC RATING
50th/ 347
METRIC RANK
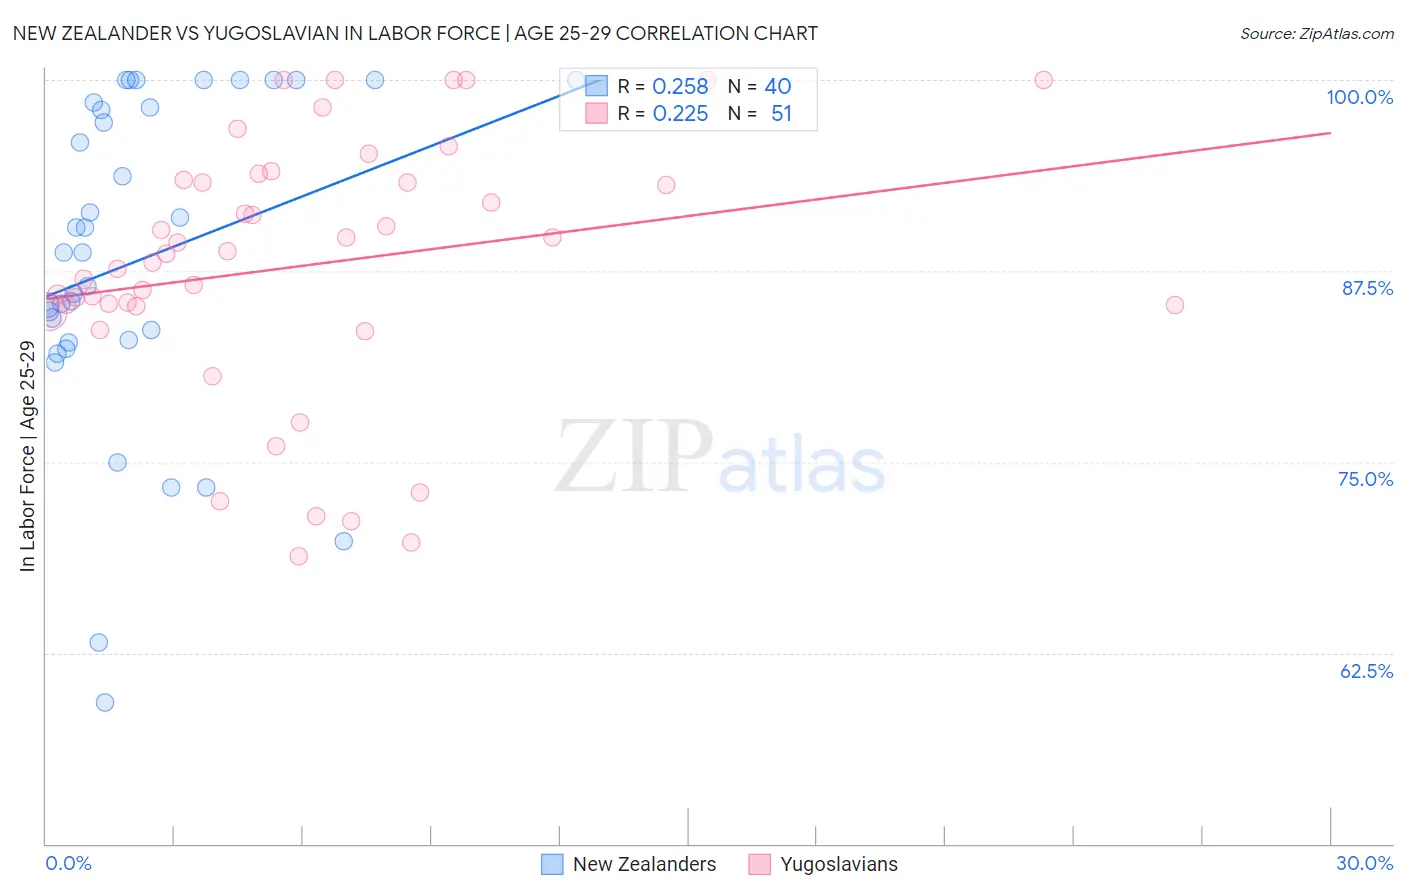
New Zealander vs Yugoslavian In Labor Force | Age 25-29 Correlation Chart
The statistical analysis conducted on geographies consisting of 106,898,789 people shows a weak positive correlation between the proportion of New Zealanders and labor force participation rate among population between the ages 25 and 29 in the United States with a correlation coefficient (R) of 0.258 and weighted average of 85.0%. Similarly, the statistical analysis conducted on geographies consisting of 285,642,405 people shows a weak positive correlation between the proportion of Yugoslavians and labor force participation rate among population between the ages 25 and 29 in the United States with a correlation coefficient (R) of 0.225 and weighted average of 85.6%, a difference of 0.67%.
In Labor Force | Age 25-29 Correlation Summary
| Measurement | New Zealander | Yugoslavian |
| Minimum | 59.3% | 68.8% |
| Maximum | 100.0% | 100.0% |
| Range | 40.7% | 31.2% |
| Mean | 88.2% | 87.9% |
| Median | 88.7% | 88.7% |
| Interquartile 25% (IQ1) | 82.9% | 85.2% |
| Interquartile 75% (IQ3) | 98.4% | 93.5% |
| Interquartile Range (IQR) | 15.5% | 8.3% |
| Standard Deviation (Sample) | 10.6% | 8.4% |
| Standard Deviation (Population) | 10.5% | 8.3% |
Similar Demographics by In Labor Force | Age 25-29
Demographics Similar to New Zealanders by In Labor Force | Age 25-29
In terms of in labor force | age 25-29, the demographic groups most similar to New Zealanders are Immigrants from Middle Africa (85.0%, a difference of 0.0%), Immigrants from Austria (85.0%, a difference of 0.010%), Costa Rican (85.0%, a difference of 0.010%), Senegalese (85.0%, a difference of 0.010%), and Immigrants from Southern Europe (85.0%, a difference of 0.020%).
| Demographics | Rating | Rank | In Labor Force | Age 25-29 |
| Immigrants | Japan | 93.5 /100 | #103 | Exceptional 85.1% |
| Immigrants | Zaire | 93.3 /100 | #104 | Exceptional 85.1% |
| Immigrants | Hong Kong | 92.8 /100 | #105 | Exceptional 85.0% |
| Czechoslovakians | 92.6 /100 | #106 | Exceptional 85.0% |
| Immigrants | Southern Europe | 92.3 /100 | #107 | Exceptional 85.0% |
| Immigrants | Austria | 91.9 /100 | #108 | Exceptional 85.0% |
| Costa Ricans | 91.9 /100 | #109 | Exceptional 85.0% |
| New Zealanders | 91.5 /100 | #110 | Exceptional 85.0% |
| Immigrants | Middle Africa | 91.4 /100 | #111 | Exceptional 85.0% |
| Senegalese | 90.9 /100 | #112 | Exceptional 85.0% |
| Irish | 90.6 /100 | #113 | Exceptional 85.0% |
| Immigrants | Malaysia | 90.4 /100 | #114 | Exceptional 85.0% |
| South Africans | 88.9 /100 | #115 | Excellent 85.0% |
| Chileans | 88.8 /100 | #116 | Excellent 85.0% |
| Immigrants | Belarus | 88.0 /100 | #117 | Excellent 85.0% |
Demographics Similar to Yugoslavians by In Labor Force | Age 25-29
In terms of in labor force | age 25-29, the demographic groups most similar to Yugoslavians are Immigrants from Latvia (85.6%, a difference of 0.0%), Swedish (85.6%, a difference of 0.030%), Immigrants from Poland (85.6%, a difference of 0.030%), Turkish (85.6%, a difference of 0.040%), and Italian (85.6%, a difference of 0.040%).
| Demographics | Rating | Rank | In Labor Force | Age 25-29 |
| Immigrants | India | 99.9 /100 | #43 | Exceptional 85.7% |
| Macedonians | 99.9 /100 | #44 | Exceptional 85.7% |
| Immigrants | Sierra Leone | 99.9 /100 | #45 | Exceptional 85.7% |
| Czechs | 99.8 /100 | #46 | Exceptional 85.6% |
| Turks | 99.8 /100 | #47 | Exceptional 85.6% |
| Italians | 99.8 /100 | #48 | Exceptional 85.6% |
| Swedes | 99.8 /100 | #49 | Exceptional 85.6% |
| Yugoslavians | 99.8 /100 | #50 | Exceptional 85.6% |
| Immigrants | Latvia | 99.8 /100 | #51 | Exceptional 85.6% |
| Immigrants | Poland | 99.7 /100 | #52 | Exceptional 85.6% |
| Belgians | 99.7 /100 | #53 | Exceptional 85.5% |
| Albanians | 99.7 /100 | #54 | Exceptional 85.5% |
| Immigrants | Brazil | 99.7 /100 | #55 | Exceptional 85.5% |
| Eastern Europeans | 99.6 /100 | #56 | Exceptional 85.5% |
| Estonians | 99.6 /100 | #57 | Exceptional 85.5% |