Puget Sound Salish vs Argentinean In Labor Force | Age 25-29
COMPARE
Puget Sound Salish
Argentinean
In Labor Force | Age 25-29
In Labor Force | Age 25-29 Comparison
Puget Sound Salish
Argentineans
83.5%
IN LABOR FORCE | AGE 25-29
0.1/ 100
METRIC RATING
264th/ 347
METRIC RANK
84.7%
IN LABOR FORCE | AGE 25-29
57.9/ 100
METRIC RATING
163rd/ 347
METRIC RANK
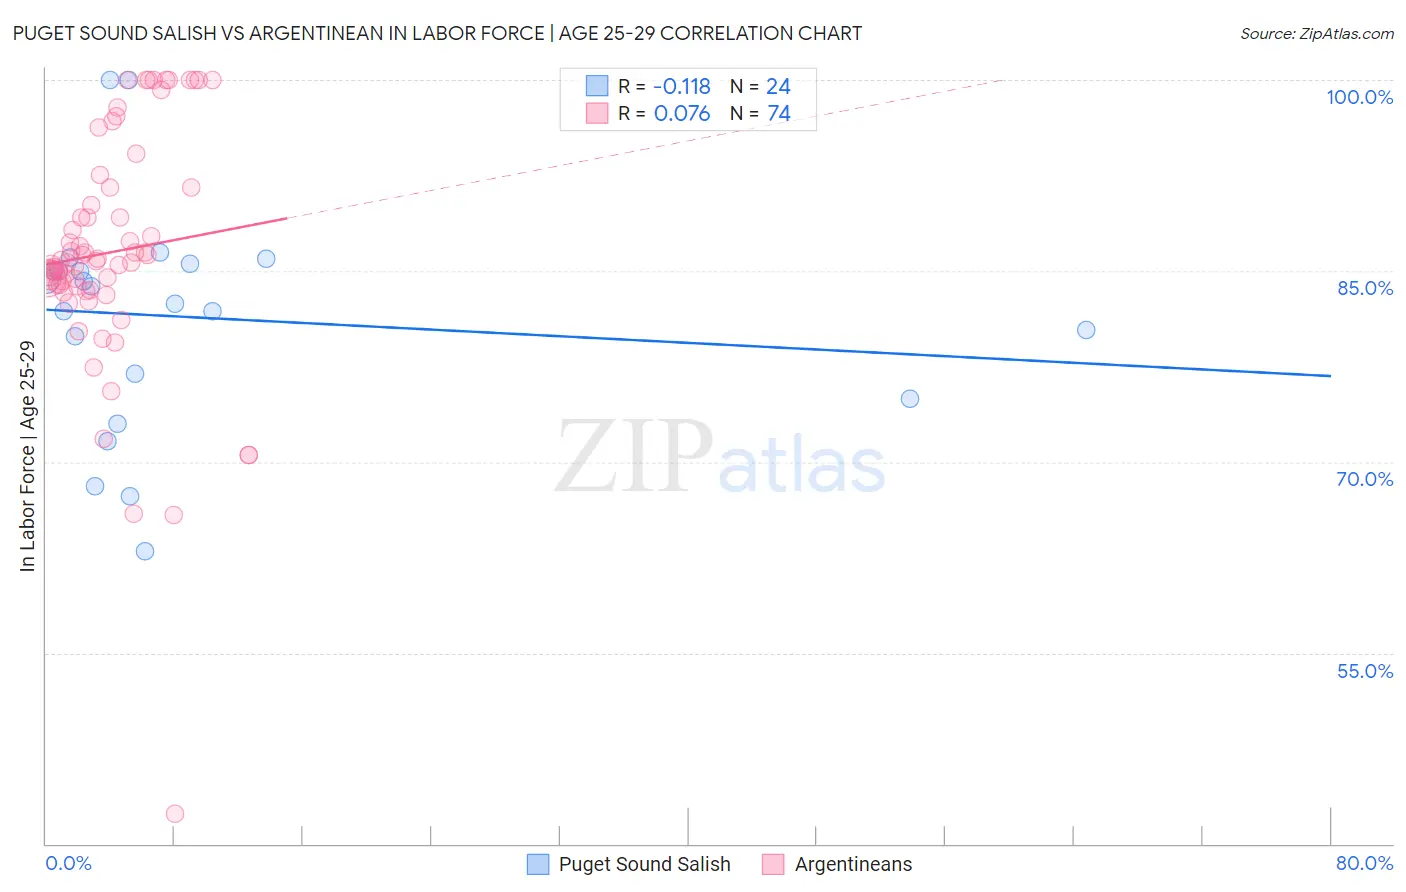
Puget Sound Salish vs Argentinean In Labor Force | Age 25-29 Correlation Chart
The statistical analysis conducted on geographies consisting of 46,150,488 people shows a poor negative correlation between the proportion of Puget Sound Salish and labor force participation rate among population between the ages 25 and 29 in the United States with a correlation coefficient (R) of -0.118 and weighted average of 83.5%. Similarly, the statistical analysis conducted on geographies consisting of 297,081,391 people shows a slight positive correlation between the proportion of Argentineans and labor force participation rate among population between the ages 25 and 29 in the United States with a correlation coefficient (R) of 0.076 and weighted average of 84.7%, a difference of 1.5%.
In Labor Force | Age 25-29 Correlation Summary
| Measurement | Puget Sound Salish | Argentinean |
| Minimum | 63.0% | 42.4% |
| Maximum | 100.0% | 100.0% |
| Range | 37.0% | 57.6% |
| Mean | 81.4% | 86.5% |
| Median | 83.1% | 85.7% |
| Interquartile 25% (IQ1) | 76.0% | 83.8% |
| Interquartile 75% (IQ3) | 85.3% | 91.6% |
| Interquartile Range (IQR) | 9.4% | 7.8% |
| Standard Deviation (Sample) | 8.8% | 9.5% |
| Standard Deviation (Population) | 8.6% | 9.5% |
Similar Demographics by In Labor Force | Age 25-29
Demographics Similar to Puget Sound Salish by In Labor Force | Age 25-29
In terms of in labor force | age 25-29, the demographic groups most similar to Puget Sound Salish are Cuban (83.5%, a difference of 0.0%), Aleut (83.4%, a difference of 0.040%), Spanish American (83.4%, a difference of 0.050%), West Indian (83.5%, a difference of 0.060%), and Immigrants from Lebanon (83.4%, a difference of 0.060%).
| Demographics | Rating | Rank | In Labor Force | Age 25-29 |
| Delaware | 0.2 /100 | #257 | Tragic 83.7% |
| Immigrants | Guatemala | 0.1 /100 | #258 | Tragic 83.6% |
| Spanish | 0.1 /100 | #259 | Tragic 83.6% |
| Immigrants | Bahamas | 0.1 /100 | #260 | Tragic 83.6% |
| Pennsylvania Germans | 0.1 /100 | #261 | Tragic 83.6% |
| Immigrants | Fiji | 0.1 /100 | #262 | Tragic 83.6% |
| West Indians | 0.1 /100 | #263 | Tragic 83.5% |
| Puget Sound Salish | 0.1 /100 | #264 | Tragic 83.5% |
| Cubans | 0.1 /100 | #265 | Tragic 83.5% |
| Aleuts | 0.0 /100 | #266 | Tragic 83.4% |
| Spanish Americans | 0.0 /100 | #267 | Tragic 83.4% |
| Immigrants | Lebanon | 0.0 /100 | #268 | Tragic 83.4% |
| Immigrants | Barbados | 0.0 /100 | #269 | Tragic 83.4% |
| Basques | 0.0 /100 | #270 | Tragic 83.4% |
| Hondurans | 0.0 /100 | #271 | Tragic 83.4% |
Demographics Similar to Argentineans by In Labor Force | Age 25-29
In terms of in labor force | age 25-29, the demographic groups most similar to Argentineans are Canadian (84.7%, a difference of 0.0%), Immigrants from Colombia (84.7%, a difference of 0.0%), Ghanaian (84.7%, a difference of 0.0%), Immigrants from Burma/Myanmar (84.7%, a difference of 0.0%), and Immigrants from Peru (84.7%, a difference of 0.010%).
| Demographics | Rating | Rank | In Labor Force | Age 25-29 |
| French | 61.0 /100 | #156 | Good 84.7% |
| British | 60.4 /100 | #157 | Good 84.7% |
| Immigrants | Ghana | 60.2 /100 | #158 | Good 84.7% |
| Immigrants | Western Africa | 60.1 /100 | #159 | Good 84.7% |
| Immigrants | Peru | 58.6 /100 | #160 | Average 84.7% |
| Canadians | 58.5 /100 | #161 | Average 84.7% |
| Immigrants | Colombia | 58.3 /100 | #162 | Average 84.7% |
| Argentineans | 57.9 /100 | #163 | Average 84.7% |
| Ghanaians | 57.6 /100 | #164 | Average 84.7% |
| Immigrants | Burma/Myanmar | 57.4 /100 | #165 | Average 84.7% |
| Immigrants | Spain | 56.9 /100 | #166 | Average 84.7% |
| Indonesians | 56.5 /100 | #167 | Average 84.7% |
| South Americans | 54.9 /100 | #168 | Average 84.7% |
| Celtics | 52.5 /100 | #169 | Average 84.7% |
| Tongans | 52.4 /100 | #170 | Average 84.7% |