Immigrants from Western Europe vs Yugoslavian In Labor Force | Age 25-29
COMPARE
Immigrants from Western Europe
Yugoslavian
In Labor Force | Age 25-29
In Labor Force | Age 25-29 Comparison
Immigrants from Western Europe
Yugoslavians
84.7%
IN LABOR FORCE | AGE 25-29
50.4/ 100
METRIC RATING
172nd/ 347
METRIC RANK
85.6%
IN LABOR FORCE | AGE 25-29
99.8/ 100
METRIC RATING
50th/ 347
METRIC RANK
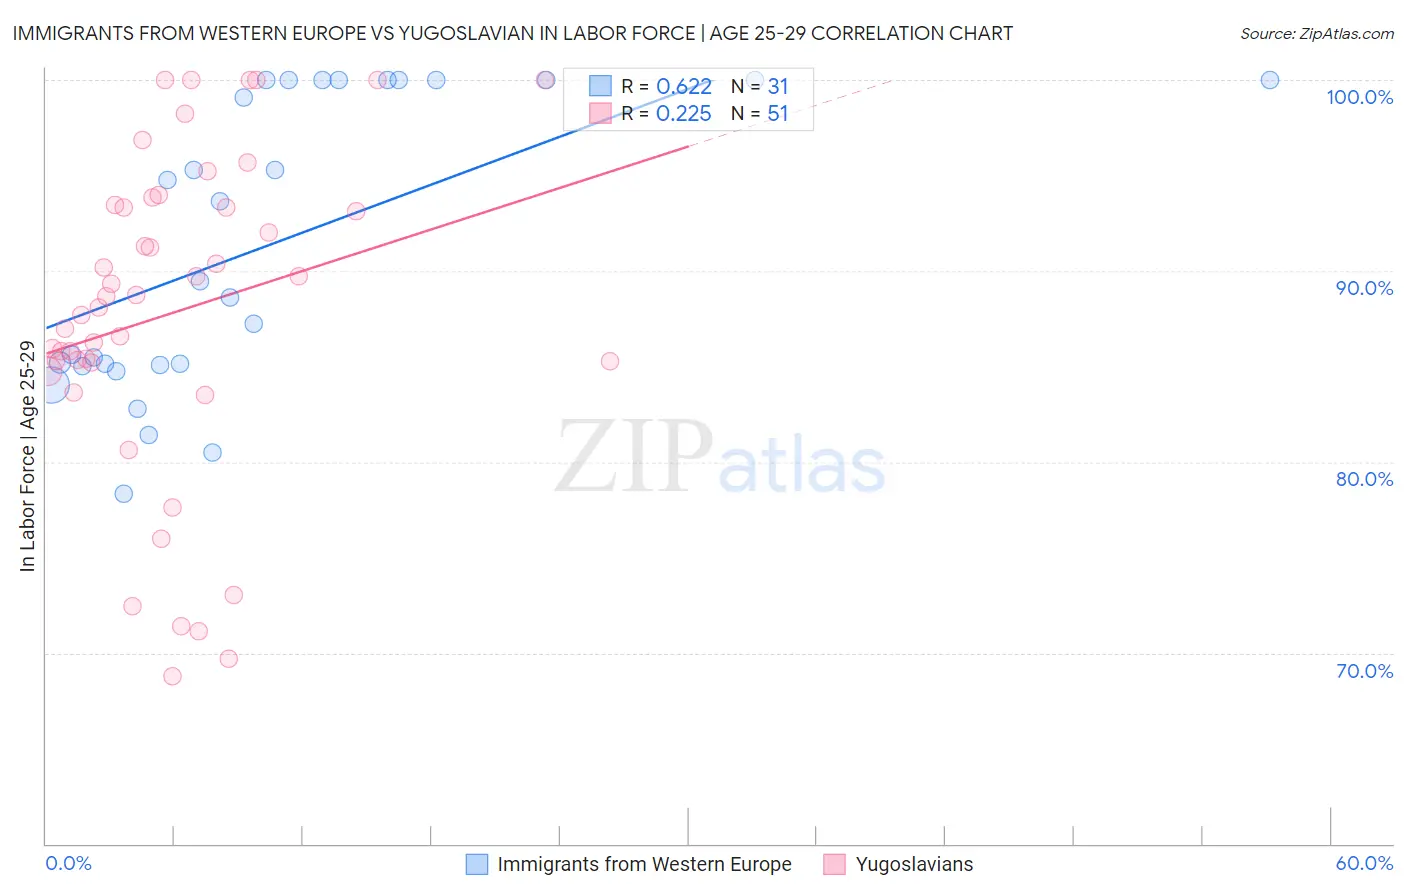
Immigrants from Western Europe vs Yugoslavian In Labor Force | Age 25-29 Correlation Chart
The statistical analysis conducted on geographies consisting of 493,653,043 people shows a significant positive correlation between the proportion of Immigrants from Western Europe and labor force participation rate among population between the ages 25 and 29 in the United States with a correlation coefficient (R) of 0.622 and weighted average of 84.7%. Similarly, the statistical analysis conducted on geographies consisting of 285,642,405 people shows a weak positive correlation between the proportion of Yugoslavians and labor force participation rate among population between the ages 25 and 29 in the United States with a correlation coefficient (R) of 0.225 and weighted average of 85.6%, a difference of 1.1%.
In Labor Force | Age 25-29 Correlation Summary
| Measurement | Immigrants from Western Europe | Yugoslavian |
| Minimum | 78.3% | 68.8% |
| Maximum | 100.0% | 100.0% |
| Range | 21.7% | 31.2% |
| Mean | 91.4% | 87.9% |
| Median | 89.5% | 88.7% |
| Interquartile 25% (IQ1) | 85.1% | 85.2% |
| Interquartile 75% (IQ3) | 100.0% | 93.5% |
| Interquartile Range (IQR) | 14.9% | 8.3% |
| Standard Deviation (Sample) | 7.5% | 8.4% |
| Standard Deviation (Population) | 7.4% | 8.3% |
Similar Demographics by In Labor Force | Age 25-29
Demographics Similar to Immigrants from Western Europe by In Labor Force | Age 25-29
In terms of in labor force | age 25-29, the demographic groups most similar to Immigrants from Western Europe are Immigrants from Vietnam (84.7%, a difference of 0.0%), Assyrian/Chaldean/Syriac (84.7%, a difference of 0.0%), Palestinian (84.7%, a difference of 0.0%), Celtic (84.7%, a difference of 0.010%), and Tongan (84.7%, a difference of 0.010%).
| Demographics | Rating | Rank | In Labor Force | Age 25-29 |
| Immigrants | Burma/Myanmar | 57.4 /100 | #165 | Average 84.7% |
| Immigrants | Spain | 56.9 /100 | #166 | Average 84.7% |
| Indonesians | 56.5 /100 | #167 | Average 84.7% |
| South Americans | 54.9 /100 | #168 | Average 84.7% |
| Celtics | 52.5 /100 | #169 | Average 84.7% |
| Tongans | 52.4 /100 | #170 | Average 84.7% |
| Immigrants | Vietnam | 50.5 /100 | #171 | Average 84.7% |
| Immigrants | Western Europe | 50.4 /100 | #172 | Average 84.7% |
| Assyrians/Chaldeans/Syriacs | 50.2 /100 | #173 | Average 84.7% |
| Palestinians | 50.0 /100 | #174 | Average 84.7% |
| Hungarians | 47.8 /100 | #175 | Average 84.6% |
| Malaysians | 46.8 /100 | #176 | Average 84.6% |
| Immigrants | China | 45.7 /100 | #177 | Average 84.6% |
| Immigrants | Thailand | 45.2 /100 | #178 | Average 84.6% |
| Immigrants | Argentina | 44.0 /100 | #179 | Average 84.6% |
Demographics Similar to Yugoslavians by In Labor Force | Age 25-29
In terms of in labor force | age 25-29, the demographic groups most similar to Yugoslavians are Immigrants from Latvia (85.6%, a difference of 0.0%), Swedish (85.6%, a difference of 0.030%), Immigrants from Poland (85.6%, a difference of 0.030%), Turkish (85.6%, a difference of 0.040%), and Italian (85.6%, a difference of 0.040%).
| Demographics | Rating | Rank | In Labor Force | Age 25-29 |
| Immigrants | India | 99.9 /100 | #43 | Exceptional 85.7% |
| Macedonians | 99.9 /100 | #44 | Exceptional 85.7% |
| Immigrants | Sierra Leone | 99.9 /100 | #45 | Exceptional 85.7% |
| Czechs | 99.8 /100 | #46 | Exceptional 85.6% |
| Turks | 99.8 /100 | #47 | Exceptional 85.6% |
| Italians | 99.8 /100 | #48 | Exceptional 85.6% |
| Swedes | 99.8 /100 | #49 | Exceptional 85.6% |
| Yugoslavians | 99.8 /100 | #50 | Exceptional 85.6% |
| Immigrants | Latvia | 99.8 /100 | #51 | Exceptional 85.6% |
| Immigrants | Poland | 99.7 /100 | #52 | Exceptional 85.6% |
| Belgians | 99.7 /100 | #53 | Exceptional 85.5% |
| Albanians | 99.7 /100 | #54 | Exceptional 85.5% |
| Immigrants | Brazil | 99.7 /100 | #55 | Exceptional 85.5% |
| Eastern Europeans | 99.6 /100 | #56 | Exceptional 85.5% |
| Estonians | 99.6 /100 | #57 | Exceptional 85.5% |