Puget Sound Salish vs Panamanian In Labor Force | Age > 16
COMPARE
Puget Sound Salish
Panamanian
In Labor Force | Age > 16
In Labor Force | Age > 16 Comparison
Puget Sound Salish
Panamanians
63.7%
IN LABOR FORCE | AGE > 16
0.0/ 100
METRIC RATING
294th/ 347
METRIC RANK
65.3%
IN LABOR FORCE | AGE > 16
75.2/ 100
METRIC RATING
158th/ 347
METRIC RANK
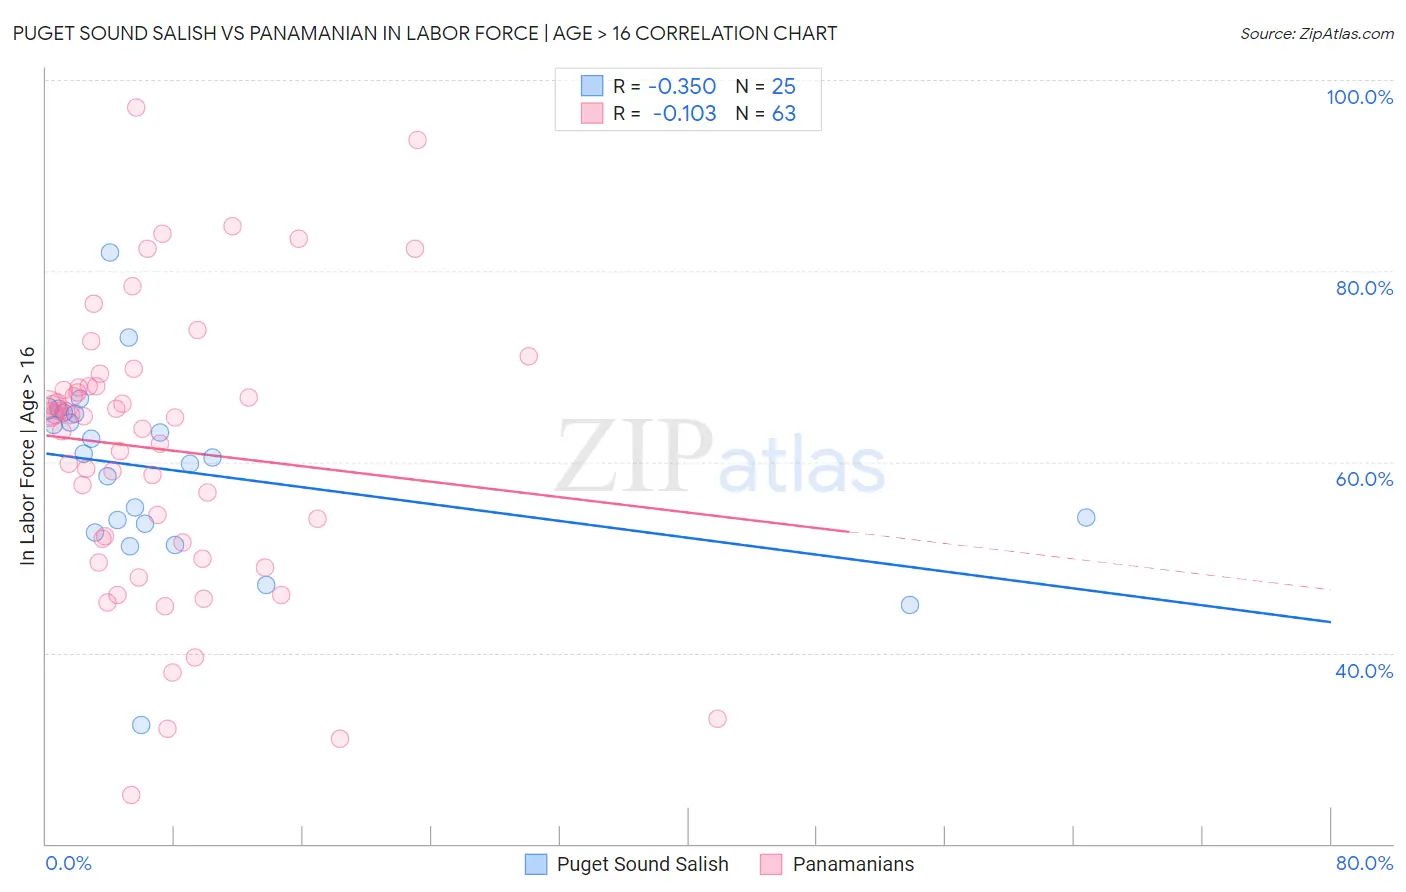
Puget Sound Salish vs Panamanian In Labor Force | Age > 16 Correlation Chart
The statistical analysis conducted on geographies consisting of 46,155,746 people shows a mild negative correlation between the proportion of Puget Sound Salish and labor force participation rate among population ages 16 and over in the United States with a correlation coefficient (R) of -0.350 and weighted average of 63.7%. Similarly, the statistical analysis conducted on geographies consisting of 281,243,472 people shows a poor negative correlation between the proportion of Panamanians and labor force participation rate among population ages 16 and over in the United States with a correlation coefficient (R) of -0.103 and weighted average of 65.3%, a difference of 2.5%.
In Labor Force | Age > 16 Correlation Summary
| Measurement | Puget Sound Salish | Panamanian |
| Minimum | 32.5% | 25.1% |
| Maximum | 81.9% | 97.1% |
| Range | 49.4% | 72.0% |
| Mean | 58.9% | 61.3% |
| Median | 60.4% | 64.8% |
| Interquartile 25% (IQ1) | 53.1% | 51.5% |
| Interquartile 75% (IQ3) | 65.1% | 67.9% |
| Interquartile Range (IQR) | 12.0% | 16.4% |
| Standard Deviation (Sample) | 9.8% | 14.7% |
| Standard Deviation (Population) | 9.6% | 14.6% |
Similar Demographics by In Labor Force | Age > 16
Demographics Similar to Puget Sound Salish by In Labor Force | Age > 16
In terms of in labor force | age > 16, the demographic groups most similar to Puget Sound Salish are English (63.7%, a difference of 0.030%), Immigrants from Canada (63.7%, a difference of 0.050%), Spanish American Indian (63.8%, a difference of 0.070%), Immigrants from North America (63.7%, a difference of 0.070%), and Nepalese (63.8%, a difference of 0.13%).
| Demographics | Rating | Rank | In Labor Force | Age > 16 |
| Scottish | 0.1 /100 | #287 | Tragic 63.9% |
| Spanish | 0.1 /100 | #288 | Tragic 63.9% |
| Celtics | 0.1 /100 | #289 | Tragic 63.8% |
| Hungarians | 0.1 /100 | #290 | Tragic 63.8% |
| Nepalese | 0.1 /100 | #291 | Tragic 63.8% |
| Spanish American Indians | 0.1 /100 | #292 | Tragic 63.8% |
| English | 0.1 /100 | #293 | Tragic 63.7% |
| Puget Sound Salish | 0.0 /100 | #294 | Tragic 63.7% |
| Immigrants | Canada | 0.0 /100 | #295 | Tragic 63.7% |
| Immigrants | North America | 0.0 /100 | #296 | Tragic 63.7% |
| Immigrants | Grenada | 0.0 /100 | #297 | Tragic 63.6% |
| Comanche | 0.0 /100 | #298 | Tragic 63.6% |
| Whites/Caucasians | 0.0 /100 | #299 | Tragic 63.6% |
| Immigrants | Azores | 0.0 /100 | #300 | Tragic 63.6% |
| Spanish Americans | 0.0 /100 | #301 | Tragic 63.6% |
Demographics Similar to Panamanians by In Labor Force | Age > 16
In terms of in labor force | age > 16, the demographic groups most similar to Panamanians are Immigrants from Ireland (65.3%, a difference of 0.010%), Immigrants from Russia (65.3%, a difference of 0.010%), Immigrants from Syria (65.3%, a difference of 0.010%), Immigrants from Armenia (65.3%, a difference of 0.020%), and Immigrants from South Africa (65.3%, a difference of 0.030%).
| Demographics | Rating | Rank | In Labor Force | Age > 16 |
| Czechs | 81.5 /100 | #151 | Excellent 65.4% |
| Yugoslavians | 81.3 /100 | #152 | Excellent 65.4% |
| Immigrants | China | 80.5 /100 | #153 | Excellent 65.4% |
| Immigrants | Eastern Europe | 78.3 /100 | #154 | Good 65.4% |
| Immigrants | Armenia | 76.6 /100 | #155 | Good 65.3% |
| Immigrants | Ireland | 75.9 /100 | #156 | Good 65.3% |
| Immigrants | Russia | 75.7 /100 | #157 | Good 65.3% |
| Panamanians | 75.2 /100 | #158 | Good 65.3% |
| Immigrants | Syria | 74.6 /100 | #159 | Good 65.3% |
| Immigrants | South Africa | 73.5 /100 | #160 | Good 65.3% |
| Australians | 71.3 /100 | #161 | Good 65.3% |
| Albanians | 70.8 /100 | #162 | Good 65.3% |
| South Africans | 69.8 /100 | #163 | Good 65.3% |
| Danes | 68.8 /100 | #164 | Good 65.3% |
| Immigrants | Kazakhstan | 68.1 /100 | #165 | Good 65.3% |