Yugoslavian vs Immigrants from Saudi Arabia In Labor Force | Age 45-54
COMPARE
Yugoslavian
Immigrants from Saudi Arabia
In Labor Force | Age 45-54
In Labor Force | Age 45-54 Comparison
Yugoslavians
Immigrants from Saudi Arabia
83.0%
IN LABOR FORCE | AGE 45-54
78.3/ 100
METRIC RATING
140th/ 347
METRIC RANK
82.9%
IN LABOR FORCE | AGE 45-54
68.8/ 100
METRIC RATING
156th/ 347
METRIC RANK
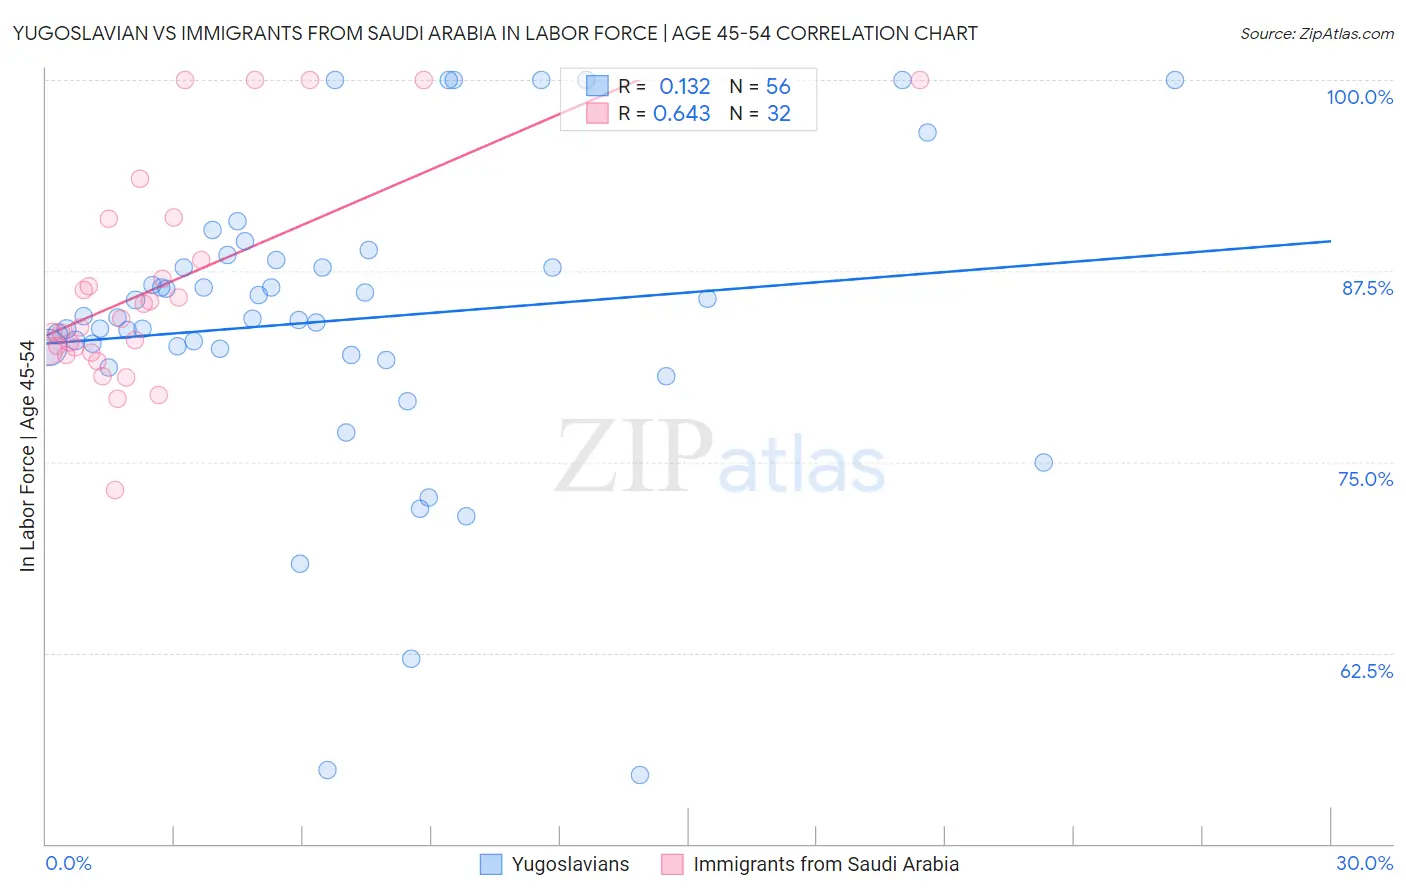
Yugoslavian vs Immigrants from Saudi Arabia In Labor Force | Age 45-54 Correlation Chart
The statistical analysis conducted on geographies consisting of 285,617,404 people shows a poor positive correlation between the proportion of Yugoslavians and labor force participation rate among population between the ages 45 and 54 in the United States with a correlation coefficient (R) of 0.132 and weighted average of 83.0%. Similarly, the statistical analysis conducted on geographies consisting of 164,195,030 people shows a significant positive correlation between the proportion of Immigrants from Saudi Arabia and labor force participation rate among population between the ages 45 and 54 in the United States with a correlation coefficient (R) of 0.643 and weighted average of 82.9%, a difference of 0.11%.
In Labor Force | Age 45-54 Correlation Summary
| Measurement | Yugoslavian | Immigrants from Saudi Arabia |
| Minimum | 54.5% | 73.1% |
| Maximum | 100.0% | 100.0% |
| Range | 45.5% | 26.9% |
| Mean | 84.3% | 86.5% |
| Median | 84.4% | 84.1% |
| Interquartile 25% (IQ1) | 82.2% | 82.2% |
| Interquartile 75% (IQ3) | 88.0% | 89.5% |
| Interquartile Range (IQR) | 5.8% | 7.3% |
| Standard Deviation (Sample) | 9.8% | 7.0% |
| Standard Deviation (Population) | 9.7% | 6.9% |
Demographics Similar to Yugoslavians and Immigrants from Saudi Arabia by In Labor Force | Age 45-54
In terms of in labor force | age 45-54, the demographic groups most similar to Yugoslavians are Scandinavian (83.0%, a difference of 0.0%), Immigrants from Haiti (83.0%, a difference of 0.010%), Immigrants from Scotland (83.0%, a difference of 0.010%), Ghanaian (83.0%, a difference of 0.020%), and Okinawan (83.0%, a difference of 0.020%). Similarly, the demographic groups most similar to Immigrants from Saudi Arabia are Immigrants from Philippines (82.9%, a difference of 0.0%), Immigrants from Australia (82.9%, a difference of 0.010%), Immigrants from Southern Europe (82.9%, a difference of 0.010%), Immigrants from Indonesia (82.9%, a difference of 0.020%), and Immigrants from Ghana (82.9%, a difference of 0.020%).
| Demographics | Rating | Rank | In Labor Force | Age 45-54 |
| Ghanaians | 79.5 /100 | #138 | Good 83.0% |
| Scandinavians | 78.5 /100 | #139 | Good 83.0% |
| Yugoslavians | 78.3 /100 | #140 | Good 83.0% |
| Immigrants | Haiti | 77.9 /100 | #141 | Good 83.0% |
| Immigrants | Scotland | 77.8 /100 | #142 | Good 83.0% |
| Okinawans | 77.0 /100 | #143 | Good 83.0% |
| Soviet Union | 76.8 /100 | #144 | Good 83.0% |
| Romanians | 75.4 /100 | #145 | Good 83.0% |
| Immigrants | France | 75.3 /100 | #146 | Good 83.0% |
| Czechoslovakians | 74.8 /100 | #147 | Good 83.0% |
| Immigrants | Nigeria | 74.1 /100 | #148 | Good 83.0% |
| Immigrants | Sweden | 73.3 /100 | #149 | Good 82.9% |
| Immigrants | Netherlands | 72.6 /100 | #150 | Good 82.9% |
| Koreans | 71.9 /100 | #151 | Good 82.9% |
| Slavs | 71.5 /100 | #152 | Good 82.9% |
| Immigrants | Indonesia | 70.6 /100 | #153 | Good 82.9% |
| Immigrants | Ghana | 70.3 /100 | #154 | Good 82.9% |
| Immigrants | Philippines | 69.0 /100 | #155 | Good 82.9% |
| Immigrants | Saudi Arabia | 68.8 /100 | #156 | Good 82.9% |
| Immigrants | Australia | 68.2 /100 | #157 | Good 82.9% |
| Immigrants | Southern Europe | 67.8 /100 | #158 | Good 82.9% |