Puget Sound Salish vs Immigrants from Saudi Arabia Master's Degree
COMPARE
Puget Sound Salish
Immigrants from Saudi Arabia
Master's Degree
Master's Degree Comparison
Puget Sound Salish
Immigrants from Saudi Arabia
11.1%
MASTER'S DEGREE
0.0/ 100
METRIC RATING
309th/ 347
METRIC RANK
19.0%
MASTER'S DEGREE
100.0/ 100
METRIC RATING
42nd/ 347
METRIC RANK
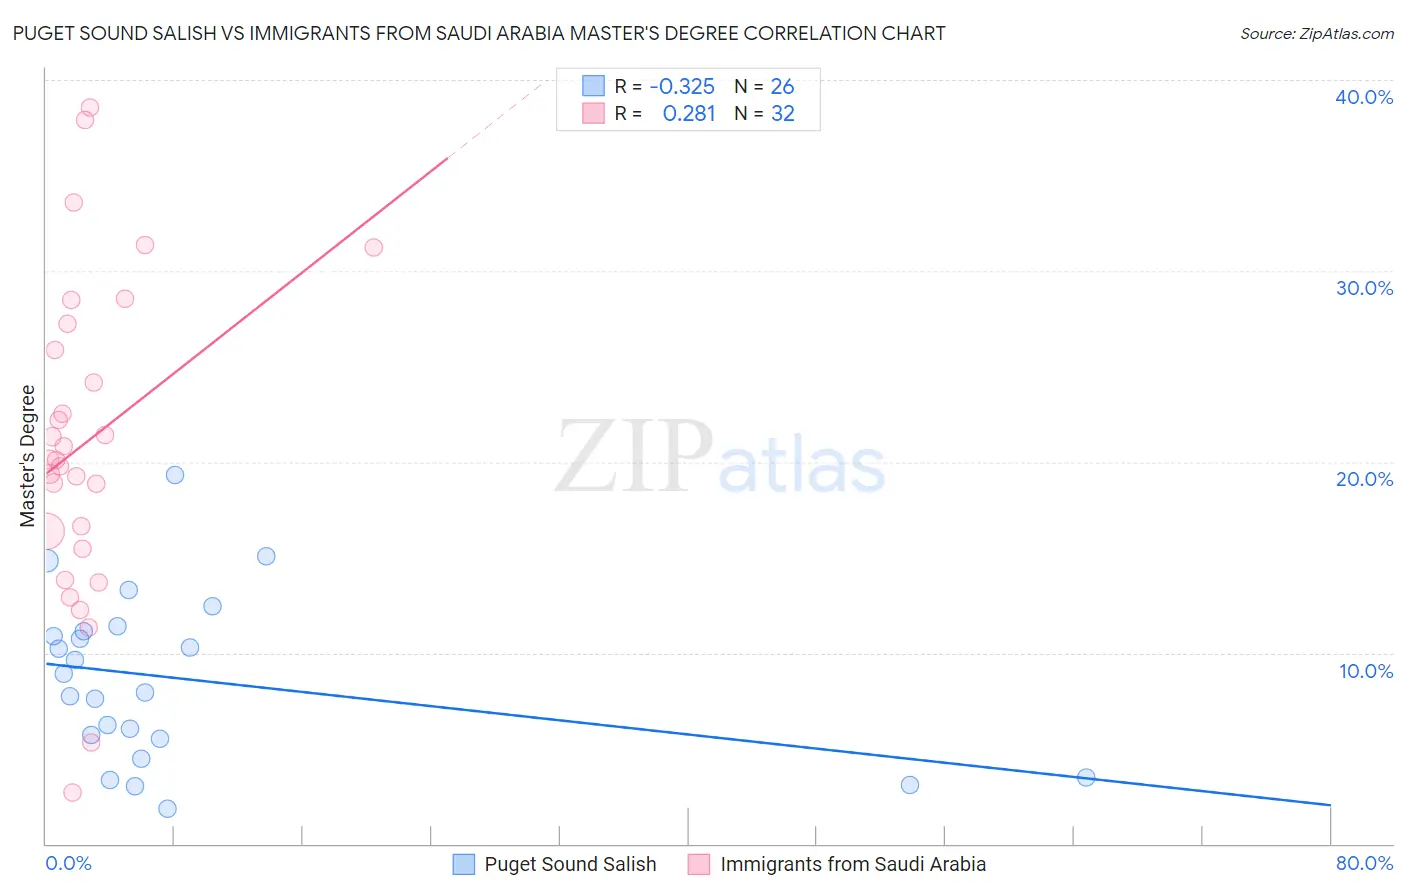
Puget Sound Salish vs Immigrants from Saudi Arabia Master's Degree Correlation Chart
The statistical analysis conducted on geographies consisting of 46,155,292 people shows a mild negative correlation between the proportion of Puget Sound Salish and percentage of population with at least master's degree education in the United States with a correlation coefficient (R) of -0.325 and weighted average of 11.1%. Similarly, the statistical analysis conducted on geographies consisting of 164,258,761 people shows a weak positive correlation between the proportion of Immigrants from Saudi Arabia and percentage of population with at least master's degree education in the United States with a correlation coefficient (R) of 0.281 and weighted average of 19.0%, a difference of 70.3%.
Master's Degree Correlation Summary
| Measurement | Puget Sound Salish | Immigrants from Saudi Arabia |
| Minimum | 1.9% | 2.7% |
| Maximum | 19.3% | 38.6% |
| Range | 17.5% | 35.9% |
| Mean | 8.6% | 21.0% |
| Median | 8.4% | 20.1% |
| Interquartile 25% (IQ1) | 5.5% | 15.9% |
| Interquartile 75% (IQ3) | 11.1% | 26.6% |
| Interquartile Range (IQR) | 5.6% | 10.6% |
| Standard Deviation (Sample) | 4.4% | 8.4% |
| Standard Deviation (Population) | 4.3% | 8.2% |
Similar Demographics by Master's Degree
Demographics Similar to Puget Sound Salish by Master's Degree
In terms of master's degree, the demographic groups most similar to Puget Sound Salish are Puerto Rican (11.2%, a difference of 0.29%), Shoshone (11.1%, a difference of 0.36%), Cheyenne (11.2%, a difference of 0.84%), Seminole (11.0%, a difference of 0.87%), and Choctaw (11.0%, a difference of 0.97%).
| Demographics | Rating | Rank | Master's Degree |
| Cherokee | 0.1 /100 | #302 | Tragic 11.4% |
| Immigrants | Laos | 0.1 /100 | #303 | Tragic 11.4% |
| Immigrants | Cabo Verde | 0.1 /100 | #304 | Tragic 11.3% |
| Immigrants | Latin America | 0.0 /100 | #305 | Tragic 11.3% |
| Mexican American Indians | 0.0 /100 | #306 | Tragic 11.2% |
| Cheyenne | 0.0 /100 | #307 | Tragic 11.2% |
| Puerto Ricans | 0.0 /100 | #308 | Tragic 11.2% |
| Puget Sound Salish | 0.0 /100 | #309 | Tragic 11.1% |
| Shoshone | 0.0 /100 | #310 | Tragic 11.1% |
| Seminole | 0.0 /100 | #311 | Tragic 11.0% |
| Choctaw | 0.0 /100 | #312 | Tragic 11.0% |
| Yaqui | 0.0 /100 | #313 | Tragic 11.0% |
| Cajuns | 0.0 /100 | #314 | Tragic 11.0% |
| Apache | 0.0 /100 | #315 | Tragic 11.0% |
| Hispanics or Latinos | 0.0 /100 | #316 | Tragic 10.9% |
Demographics Similar to Immigrants from Saudi Arabia by Master's Degree
In terms of master's degree, the demographic groups most similar to Immigrants from Saudi Arabia are Immigrants from Greece (19.0%, a difference of 0.010%), Immigrants from Malaysia (18.9%, a difference of 0.29%), Immigrants from Belarus (18.9%, a difference of 0.40%), Immigrants from Latvia (19.1%, a difference of 0.43%), and Immigrants from Bolivia (19.1%, a difference of 0.78%).
| Demographics | Rating | Rank | Master's Degree |
| Immigrants | Northern Europe | 100.0 /100 | #35 | Exceptional 19.5% |
| Immigrants | Russia | 100.0 /100 | #36 | Exceptional 19.4% |
| Mongolians | 100.0 /100 | #37 | Exceptional 19.4% |
| Bolivians | 100.0 /100 | #38 | Exceptional 19.3% |
| Immigrants | Spain | 100.0 /100 | #39 | Exceptional 19.1% |
| Immigrants | Bolivia | 100.0 /100 | #40 | Exceptional 19.1% |
| Immigrants | Latvia | 100.0 /100 | #41 | Exceptional 19.1% |
| Immigrants | Saudi Arabia | 100.0 /100 | #42 | Exceptional 19.0% |
| Immigrants | Greece | 100.0 /100 | #43 | Exceptional 19.0% |
| Immigrants | Malaysia | 100.0 /100 | #44 | Exceptional 18.9% |
| Immigrants | Belarus | 100.0 /100 | #45 | Exceptional 18.9% |
| Immigrants | Norway | 100.0 /100 | #46 | Exceptional 18.8% |
| Immigrants | Austria | 100.0 /100 | #47 | Exceptional 18.8% |
| Paraguayans | 100.0 /100 | #48 | Exceptional 18.8% |
| Estonians | 100.0 /100 | #49 | Exceptional 18.8% |