American vs Argentinean In Labor Force | Age 25-29
COMPARE
American
Argentinean
In Labor Force | Age 25-29
In Labor Force | Age 25-29 Comparison
Americans
Argentineans
83.1%
IN LABOR FORCE | AGE 25-29
0.0/ 100
METRIC RATING
282nd/ 347
METRIC RANK
84.7%
IN LABOR FORCE | AGE 25-29
57.9/ 100
METRIC RATING
163rd/ 347
METRIC RANK
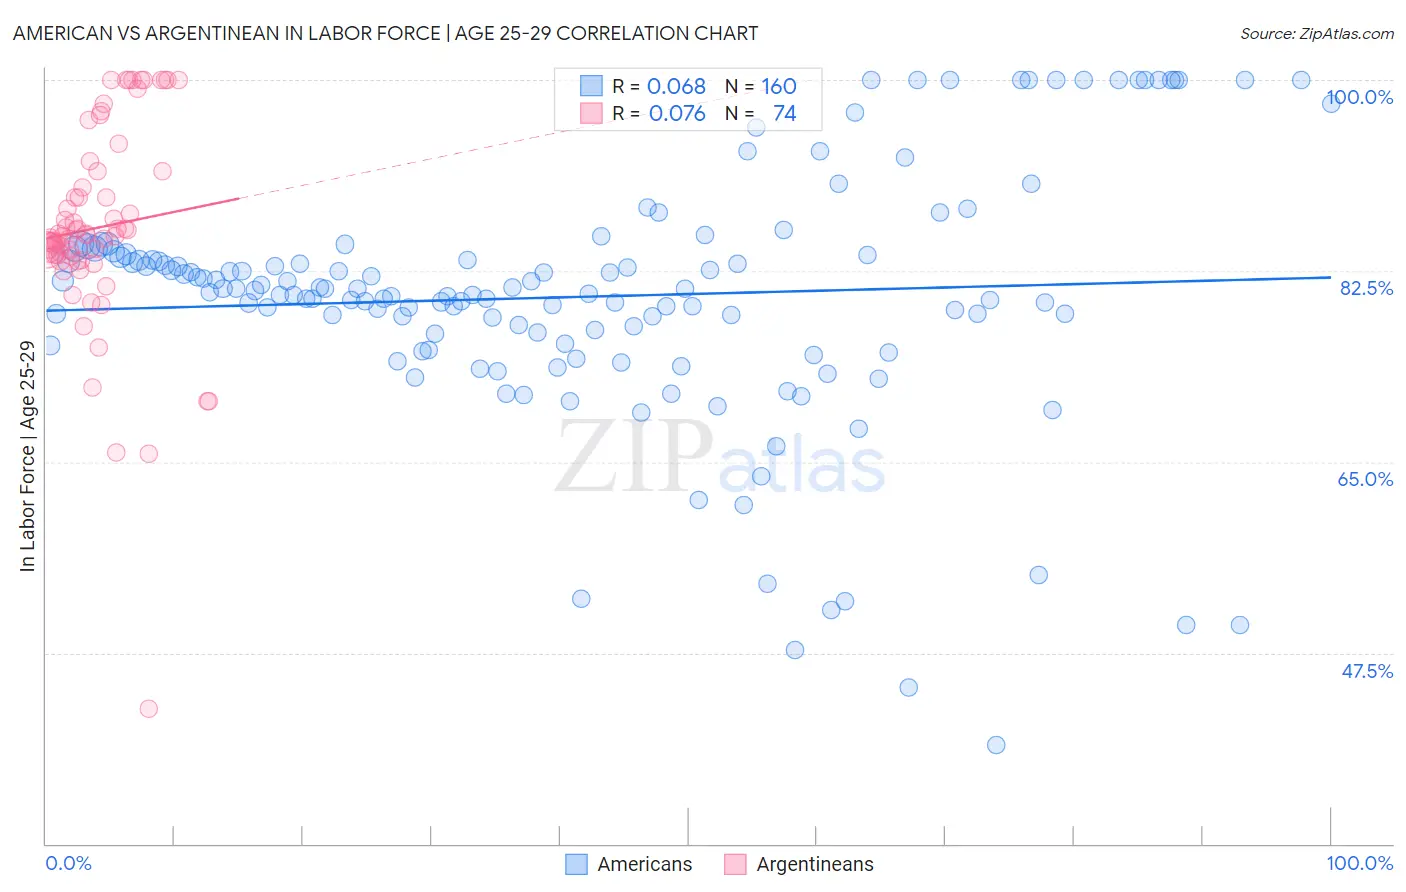
American vs Argentinean In Labor Force | Age 25-29 Correlation Chart
The statistical analysis conducted on geographies consisting of 580,038,437 people shows a slight positive correlation between the proportion of Americans and labor force participation rate among population between the ages 25 and 29 in the United States with a correlation coefficient (R) of 0.068 and weighted average of 83.1%. Similarly, the statistical analysis conducted on geographies consisting of 297,081,391 people shows a slight positive correlation between the proportion of Argentineans and labor force participation rate among population between the ages 25 and 29 in the United States with a correlation coefficient (R) of 0.076 and weighted average of 84.7%, a difference of 1.9%.
In Labor Force | Age 25-29 Correlation Summary
| Measurement | American | Argentinean |
| Minimum | 39.0% | 42.4% |
| Maximum | 100.0% | 100.0% |
| Range | 61.0% | 57.6% |
| Mean | 80.1% | 86.5% |
| Median | 80.6% | 85.7% |
| Interquartile 25% (IQ1) | 76.3% | 83.8% |
| Interquartile 75% (IQ3) | 84.0% | 91.6% |
| Interquartile Range (IQR) | 7.7% | 7.8% |
| Standard Deviation (Sample) | 11.5% | 9.5% |
| Standard Deviation (Population) | 11.5% | 9.5% |
Similar Demographics by In Labor Force | Age 25-29
Demographics Similar to Americans by In Labor Force | Age 25-29
In terms of in labor force | age 25-29, the demographic groups most similar to Americans are Immigrants from the Azores (83.1%, a difference of 0.0%), Immigrants from Dominican Republic (83.1%, a difference of 0.010%), Nicaraguan (83.1%, a difference of 0.020%), Belizean (83.1%, a difference of 0.060%), and Dominican (83.2%, a difference of 0.070%).
| Demographics | Rating | Rank | In Labor Force | Age 25-29 |
| Samoans | 0.0 /100 | #275 | Tragic 83.3% |
| Immigrants | Honduras | 0.0 /100 | #276 | Tragic 83.3% |
| Africans | 0.0 /100 | #277 | Tragic 83.2% |
| Immigrants | Cuba | 0.0 /100 | #278 | Tragic 83.2% |
| British West Indians | 0.0 /100 | #279 | Tragic 83.2% |
| Dominicans | 0.0 /100 | #280 | Tragic 83.2% |
| Immigrants | Dominican Republic | 0.0 /100 | #281 | Tragic 83.1% |
| Americans | 0.0 /100 | #282 | Tragic 83.1% |
| Immigrants | Azores | 0.0 /100 | #283 | Tragic 83.1% |
| Nicaraguans | 0.0 /100 | #284 | Tragic 83.1% |
| Belizeans | 0.0 /100 | #285 | Tragic 83.1% |
| Mexican American Indians | 0.0 /100 | #286 | Tragic 83.0% |
| Guyanese | 0.0 /100 | #287 | Tragic 83.0% |
| Ottawa | 0.0 /100 | #288 | Tragic 83.0% |
| Immigrants | Micronesia | 0.0 /100 | #289 | Tragic 83.0% |
Demographics Similar to Argentineans by In Labor Force | Age 25-29
In terms of in labor force | age 25-29, the demographic groups most similar to Argentineans are Canadian (84.7%, a difference of 0.0%), Immigrants from Colombia (84.7%, a difference of 0.0%), Ghanaian (84.7%, a difference of 0.0%), Immigrants from Burma/Myanmar (84.7%, a difference of 0.0%), and Immigrants from Peru (84.7%, a difference of 0.010%).
| Demographics | Rating | Rank | In Labor Force | Age 25-29 |
| French | 61.0 /100 | #156 | Good 84.7% |
| British | 60.4 /100 | #157 | Good 84.7% |
| Immigrants | Ghana | 60.2 /100 | #158 | Good 84.7% |
| Immigrants | Western Africa | 60.1 /100 | #159 | Good 84.7% |
| Immigrants | Peru | 58.6 /100 | #160 | Average 84.7% |
| Canadians | 58.5 /100 | #161 | Average 84.7% |
| Immigrants | Colombia | 58.3 /100 | #162 | Average 84.7% |
| Argentineans | 57.9 /100 | #163 | Average 84.7% |
| Ghanaians | 57.6 /100 | #164 | Average 84.7% |
| Immigrants | Burma/Myanmar | 57.4 /100 | #165 | Average 84.7% |
| Immigrants | Spain | 56.9 /100 | #166 | Average 84.7% |
| Indonesians | 56.5 /100 | #167 | Average 84.7% |
| South Americans | 54.9 /100 | #168 | Average 84.7% |
| Celtics | 52.5 /100 | #169 | Average 84.7% |
| Tongans | 52.4 /100 | #170 | Average 84.7% |