Austrian vs Argentinean In Labor Force | Age 25-29
COMPARE
Austrian
Argentinean
In Labor Force | Age 25-29
In Labor Force | Age 25-29 Comparison
Austrians
Argentineans
85.1%
IN LABOR FORCE | AGE 25-29
95.3/ 100
METRIC RATING
93rd/ 347
METRIC RANK
84.7%
IN LABOR FORCE | AGE 25-29
57.9/ 100
METRIC RATING
163rd/ 347
METRIC RANK
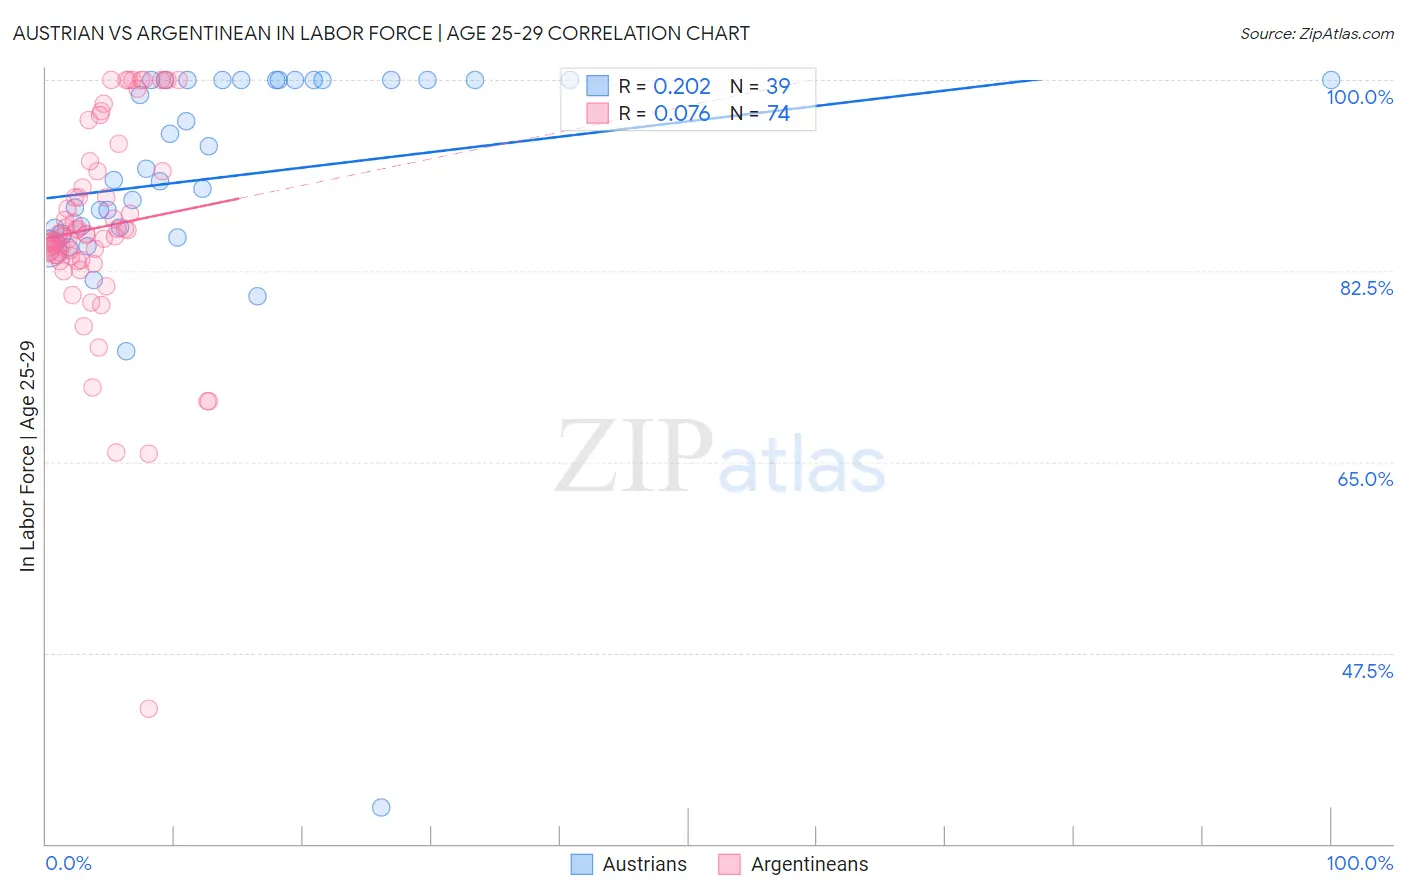
Austrian vs Argentinean In Labor Force | Age 25-29 Correlation Chart
The statistical analysis conducted on geographies consisting of 451,766,643 people shows a weak positive correlation between the proportion of Austrians and labor force participation rate among population between the ages 25 and 29 in the United States with a correlation coefficient (R) of 0.202 and weighted average of 85.1%. Similarly, the statistical analysis conducted on geographies consisting of 297,081,391 people shows a slight positive correlation between the proportion of Argentineans and labor force participation rate among population between the ages 25 and 29 in the United States with a correlation coefficient (R) of 0.076 and weighted average of 84.7%, a difference of 0.50%.
In Labor Force | Age 25-29 Correlation Summary
| Measurement | Austrian | Argentinean |
| Minimum | 33.3% | 42.4% |
| Maximum | 100.0% | 100.0% |
| Range | 66.7% | 57.6% |
| Mean | 91.2% | 86.5% |
| Median | 91.8% | 85.7% |
| Interquartile 25% (IQ1) | 86.4% | 83.8% |
| Interquartile 75% (IQ3) | 100.0% | 91.6% |
| Interquartile Range (IQR) | 13.6% | 7.8% |
| Standard Deviation (Sample) | 11.9% | 9.5% |
| Standard Deviation (Population) | 11.7% | 9.5% |
Similar Demographics by In Labor Force | Age 25-29
Demographics Similar to Austrians by In Labor Force | Age 25-29
In terms of in labor force | age 25-29, the demographic groups most similar to Austrians are Immigrants from Costa Rica (85.1%, a difference of 0.010%), Immigrants from Moldova (85.1%, a difference of 0.020%), Immigrants from Korea (85.1%, a difference of 0.020%), Burmese (85.1%, a difference of 0.030%), and Immigrants from Netherlands (85.1%, a difference of 0.030%).
| Demographics | Rating | Rank | In Labor Force | Age 25-29 |
| Ukrainians | 96.7 /100 | #86 | Exceptional 85.2% |
| French Canadians | 96.5 /100 | #87 | Exceptional 85.2% |
| Immigrants | Croatia | 96.4 /100 | #88 | Exceptional 85.2% |
| Immigrants | France | 96.3 /100 | #89 | Exceptional 85.2% |
| Burmese | 95.9 /100 | #90 | Exceptional 85.1% |
| Immigrants | Moldova | 95.8 /100 | #91 | Exceptional 85.1% |
| Immigrants | Costa Rica | 95.5 /100 | #92 | Exceptional 85.1% |
| Austrians | 95.3 /100 | #93 | Exceptional 85.1% |
| Immigrants | Korea | 94.8 /100 | #94 | Exceptional 85.1% |
| Immigrants | Netherlands | 94.6 /100 | #95 | Exceptional 85.1% |
| Immigrants | Romania | 94.6 /100 | #96 | Exceptional 85.1% |
| Immigrants | Sudan | 94.3 /100 | #97 | Exceptional 85.1% |
| Mongolians | 94.1 /100 | #98 | Exceptional 85.1% |
| Bangladeshis | 94.0 /100 | #99 | Exceptional 85.1% |
| Immigrants | Switzerland | 93.9 /100 | #100 | Exceptional 85.1% |
Demographics Similar to Argentineans by In Labor Force | Age 25-29
In terms of in labor force | age 25-29, the demographic groups most similar to Argentineans are Canadian (84.7%, a difference of 0.0%), Immigrants from Colombia (84.7%, a difference of 0.0%), Ghanaian (84.7%, a difference of 0.0%), Immigrants from Burma/Myanmar (84.7%, a difference of 0.0%), and Immigrants from Peru (84.7%, a difference of 0.010%).
| Demographics | Rating | Rank | In Labor Force | Age 25-29 |
| French | 61.0 /100 | #156 | Good 84.7% |
| British | 60.4 /100 | #157 | Good 84.7% |
| Immigrants | Ghana | 60.2 /100 | #158 | Good 84.7% |
| Immigrants | Western Africa | 60.1 /100 | #159 | Good 84.7% |
| Immigrants | Peru | 58.6 /100 | #160 | Average 84.7% |
| Canadians | 58.5 /100 | #161 | Average 84.7% |
| Immigrants | Colombia | 58.3 /100 | #162 | Average 84.7% |
| Argentineans | 57.9 /100 | #163 | Average 84.7% |
| Ghanaians | 57.6 /100 | #164 | Average 84.7% |
| Immigrants | Burma/Myanmar | 57.4 /100 | #165 | Average 84.7% |
| Immigrants | Spain | 56.9 /100 | #166 | Average 84.7% |
| Indonesians | 56.5 /100 | #167 | Average 84.7% |
| South Americans | 54.9 /100 | #168 | Average 84.7% |
| Celtics | 52.5 /100 | #169 | Average 84.7% |
| Tongans | 52.4 /100 | #170 | Average 84.7% |