Colville vs Tlingit-Haida In Labor Force | Age 20-64
COMPARE
Colville
Tlingit-Haida
In Labor Force | Age 20-64
In Labor Force | Age 20-64 Comparison
Colville
Tlingit-Haida
74.8%
IN LABOR FORCE | AGE 20-64
0.0/ 100
METRIC RATING
330th/ 347
METRIC RANK
79.0%
IN LABOR FORCE | AGE 20-64
3.2/ 100
METRIC RATING
235th/ 347
METRIC RANK
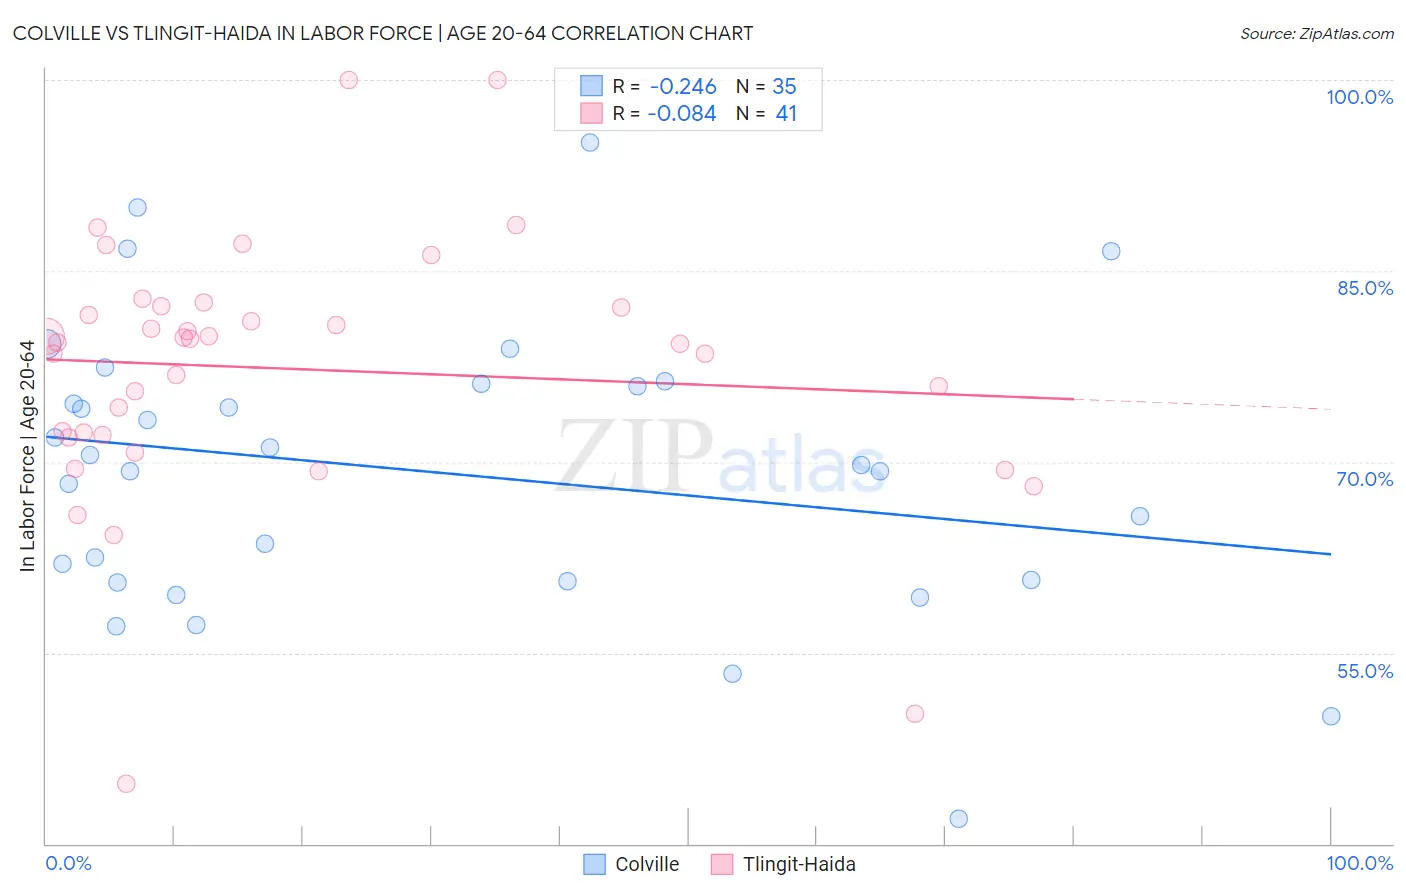
Colville vs Tlingit-Haida In Labor Force | Age 20-64 Correlation Chart
The statistical analysis conducted on geographies consisting of 34,687,839 people shows a weak negative correlation between the proportion of Colville and labor force participation rate among population between the ages 20 and 64 in the United States with a correlation coefficient (R) of -0.246 and weighted average of 74.8%. Similarly, the statistical analysis conducted on geographies consisting of 60,871,082 people shows a slight negative correlation between the proportion of Tlingit-Haida and labor force participation rate among population between the ages 20 and 64 in the United States with a correlation coefficient (R) of -0.084 and weighted average of 79.0%, a difference of 5.7%.
In Labor Force | Age 20-64 Correlation Summary
| Measurement | Colville | Tlingit-Haida |
| Minimum | 42.0% | 44.7% |
| Maximum | 95.1% | 100.0% |
| Range | 53.1% | 55.3% |
| Mean | 69.2% | 77.3% |
| Median | 69.8% | 79.4% |
| Interquartile 25% (IQ1) | 60.6% | 72.0% |
| Interquartile 75% (IQ3) | 76.1% | 82.1% |
| Interquartile Range (IQR) | 15.5% | 10.1% |
| Standard Deviation (Sample) | 11.4% | 10.4% |
| Standard Deviation (Population) | 11.3% | 10.2% |
Similar Demographics by In Labor Force | Age 20-64
Demographics Similar to Colville by In Labor Force | Age 20-64
In terms of in labor force | age 20-64, the demographic groups most similar to Colville are Cheyenne (74.8%, a difference of 0.070%), Paiute (74.7%, a difference of 0.13%), Kiowa (75.0%, a difference of 0.26%), Sioux (75.0%, a difference of 0.29%), and Creek (75.1%, a difference of 0.47%).
| Demographics | Rating | Rank | In Labor Force | Age 20-64 |
| Cajuns | 0.0 /100 | #323 | Tragic 75.5% |
| Choctaw | 0.0 /100 | #324 | Tragic 75.4% |
| Menominee | 0.0 /100 | #325 | Tragic 75.3% |
| Creek | 0.0 /100 | #326 | Tragic 75.1% |
| Sioux | 0.0 /100 | #327 | Tragic 75.0% |
| Kiowa | 0.0 /100 | #328 | Tragic 75.0% |
| Cheyenne | 0.0 /100 | #329 | Tragic 74.8% |
| Colville | 0.0 /100 | #330 | Tragic 74.8% |
| Paiute | 0.0 /100 | #331 | Tragic 74.7% |
| Arapaho | 0.0 /100 | #332 | Tragic 74.4% |
| Natives/Alaskans | 0.0 /100 | #333 | Tragic 73.9% |
| Apache | 0.0 /100 | #334 | Tragic 73.7% |
| Ute | 0.0 /100 | #335 | Tragic 73.7% |
| Crow | 0.0 /100 | #336 | Tragic 73.3% |
| Yup'ik | 0.0 /100 | #337 | Tragic 73.2% |
Demographics Similar to Tlingit-Haida by In Labor Force | Age 20-64
In terms of in labor force | age 20-64, the demographic groups most similar to Tlingit-Haida are Immigrants from Canada (79.0%, a difference of 0.0%), Samoan (79.0%, a difference of 0.020%), Immigrants from North America (79.0%, a difference of 0.020%), Immigrants from Jamaica (79.0%, a difference of 0.040%), and Japanese (79.1%, a difference of 0.050%).
| Demographics | Rating | Rank | In Labor Force | Age 20-64 |
| Panamanians | 5.7 /100 | #228 | Tragic 79.1% |
| Alsatians | 5.7 /100 | #229 | Tragic 79.1% |
| Native Hawaiians | 5.6 /100 | #230 | Tragic 79.1% |
| Lebanese | 5.1 /100 | #231 | Tragic 79.1% |
| Guamanians/Chamorros | 4.5 /100 | #232 | Tragic 79.1% |
| Japanese | 4.0 /100 | #233 | Tragic 79.1% |
| Immigrants | Canada | 3.2 /100 | #234 | Tragic 79.0% |
| Tlingit-Haida | 3.2 /100 | #235 | Tragic 79.0% |
| Samoans | 2.9 /100 | #236 | Tragic 79.0% |
| Immigrants | North America | 2.9 /100 | #237 | Tragic 79.0% |
| Immigrants | Jamaica | 2.6 /100 | #238 | Tragic 79.0% |
| Welsh | 2.4 /100 | #239 | Tragic 79.0% |
| Trinidadians and Tobagonians | 2.3 /100 | #240 | Tragic 79.0% |
| Jamaicans | 2.0 /100 | #241 | Tragic 78.9% |
| Immigrants | Micronesia | 1.9 /100 | #242 | Tragic 78.9% |