Hawaiian vs Tlingit-Haida In Labor Force | Age 20-64
COMPARE
Hawaiian
Tlingit-Haida
In Labor Force | Age 20-64
In Labor Force | Age 20-64 Comparison
Hawaiians
Tlingit-Haida
78.7%
IN LABOR FORCE | AGE 20-64
0.5/ 100
METRIC RATING
255th/ 347
METRIC RANK
79.0%
IN LABOR FORCE | AGE 20-64
3.2/ 100
METRIC RATING
235th/ 347
METRIC RANK
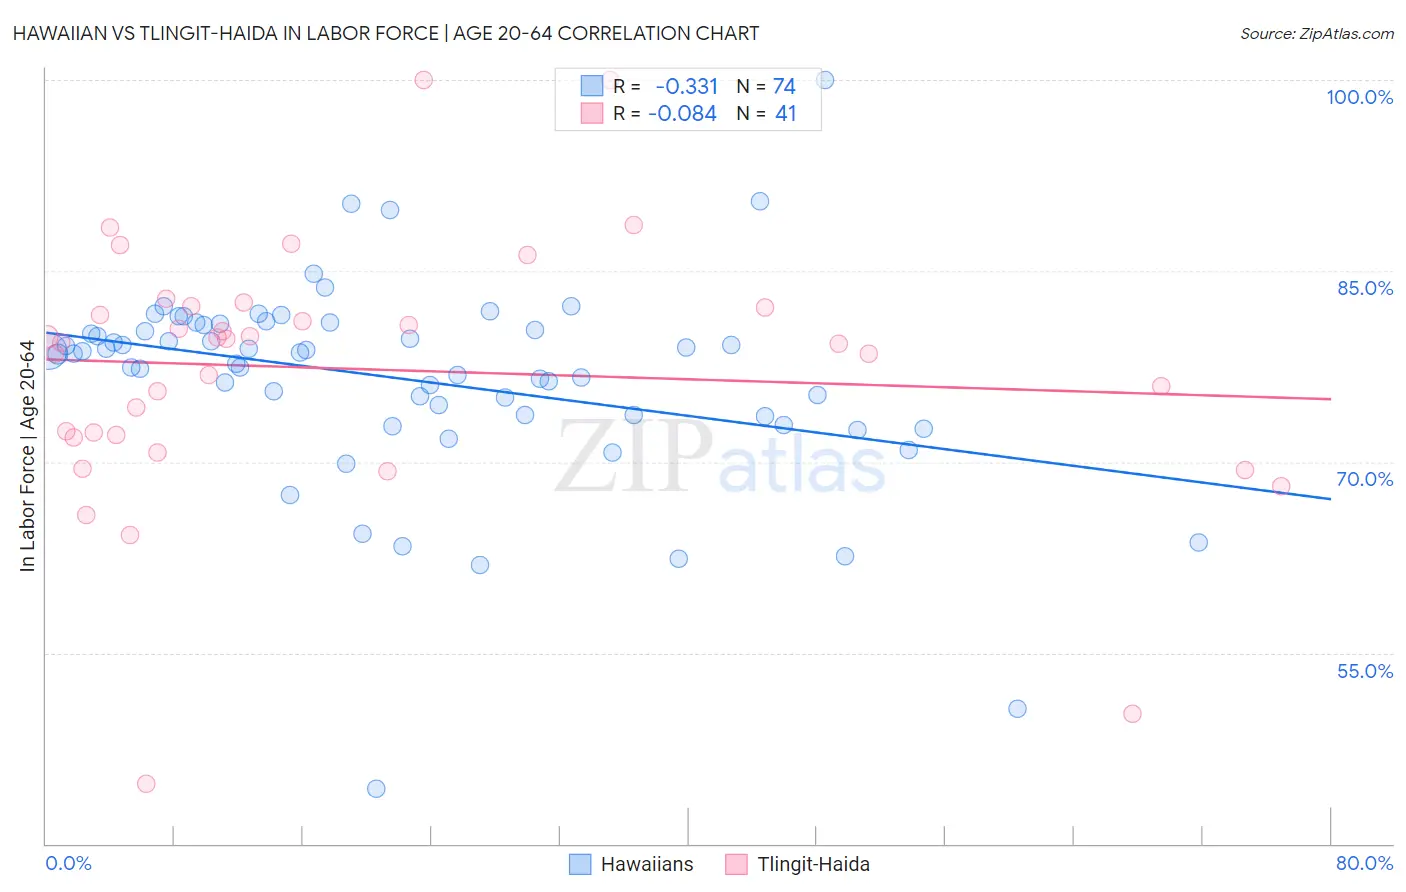
Hawaiian vs Tlingit-Haida In Labor Force | Age 20-64 Correlation Chart
The statistical analysis conducted on geographies consisting of 327,600,700 people shows a mild negative correlation between the proportion of Hawaiians and labor force participation rate among population between the ages 20 and 64 in the United States with a correlation coefficient (R) of -0.331 and weighted average of 78.7%. Similarly, the statistical analysis conducted on geographies consisting of 60,871,082 people shows a slight negative correlation between the proportion of Tlingit-Haida and labor force participation rate among population between the ages 20 and 64 in the United States with a correlation coefficient (R) of -0.084 and weighted average of 79.0%, a difference of 0.39%.
In Labor Force | Age 20-64 Correlation Summary
| Measurement | Hawaiian | Tlingit-Haida |
| Minimum | 44.3% | 44.7% |
| Maximum | 100.0% | 100.0% |
| Range | 55.7% | 55.3% |
| Mean | 76.5% | 77.3% |
| Median | 78.6% | 79.4% |
| Interquartile 25% (IQ1) | 73.6% | 72.0% |
| Interquartile 75% (IQ3) | 80.7% | 82.1% |
| Interquartile Range (IQR) | 7.1% | 10.1% |
| Standard Deviation (Sample) | 8.1% | 10.4% |
| Standard Deviation (Population) | 8.1% | 10.2% |
Demographics Similar to Hawaiians and Tlingit-Haida by In Labor Force | Age 20-64
In terms of in labor force | age 20-64, the demographic groups most similar to Hawaiians are Basque (78.7%, a difference of 0.020%), Immigrants from Lebanon (78.7%, a difference of 0.020%), Immigrants from Honduras (78.7%, a difference of 0.030%), Barbadian (78.8%, a difference of 0.080%), and Honduran (78.8%, a difference of 0.11%). Similarly, the demographic groups most similar to Tlingit-Haida are Samoan (79.0%, a difference of 0.020%), Immigrants from North America (79.0%, a difference of 0.020%), Immigrants from Jamaica (79.0%, a difference of 0.040%), Welsh (79.0%, a difference of 0.060%), and Trinidadian and Tobagonian (79.0%, a difference of 0.070%).
| Demographics | Rating | Rank | In Labor Force | Age 20-64 |
| Tlingit-Haida | 3.2 /100 | #235 | Tragic 79.0% |
| Samoans | 2.9 /100 | #236 | Tragic 79.0% |
| Immigrants | North America | 2.9 /100 | #237 | Tragic 79.0% |
| Immigrants | Jamaica | 2.6 /100 | #238 | Tragic 79.0% |
| Welsh | 2.4 /100 | #239 | Tragic 79.0% |
| Trinidadians and Tobagonians | 2.3 /100 | #240 | Tragic 79.0% |
| Jamaicans | 2.0 /100 | #241 | Tragic 78.9% |
| Immigrants | Micronesia | 1.9 /100 | #242 | Tragic 78.9% |
| Immigrants | West Indies | 1.7 /100 | #243 | Tragic 78.9% |
| French | 1.5 /100 | #244 | Tragic 78.9% |
| Scottish | 1.3 /100 | #245 | Tragic 78.9% |
| Immigrants | Trinidad and Tobago | 1.1 /100 | #246 | Tragic 78.8% |
| Immigrants | Germany | 1.0 /100 | #247 | Tragic 78.8% |
| Immigrants | Caribbean | 1.0 /100 | #248 | Tragic 78.8% |
| English | 0.9 /100 | #249 | Tragic 78.8% |
| Hondurans | 0.8 /100 | #250 | Tragic 78.8% |
| Barbadians | 0.7 /100 | #251 | Tragic 78.8% |
| Immigrants | Honduras | 0.6 /100 | #252 | Tragic 78.7% |
| Basques | 0.5 /100 | #253 | Tragic 78.7% |
| Immigrants | Lebanon | 0.5 /100 | #254 | Tragic 78.7% |
| Hawaiians | 0.5 /100 | #255 | Tragic 78.7% |