Peruvian vs Immigrants from Southern Europe In Labor Force | Age 20-64
COMPARE
Peruvian
Immigrants from Southern Europe
In Labor Force | Age 20-64
In Labor Force | Age 20-64 Comparison
Peruvians
Immigrants from Southern Europe
80.3%
IN LABOR FORCE | AGE 20-64
99.1/ 100
METRIC RATING
54th/ 347
METRIC RANK
79.8%
IN LABOR FORCE | AGE 20-64
78.9/ 100
METRIC RATING
146th/ 347
METRIC RANK
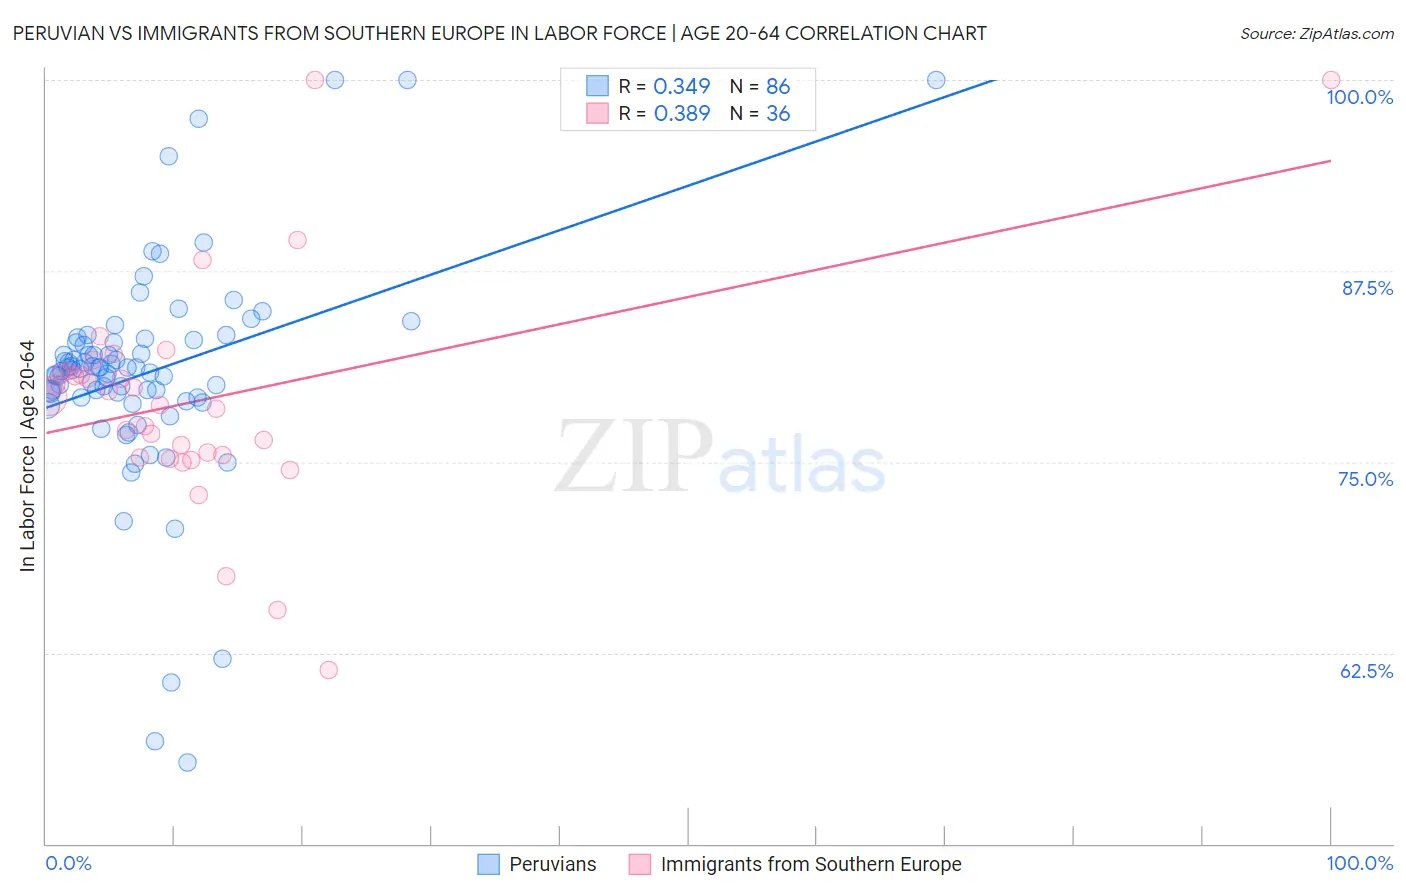
Peruvian vs Immigrants from Southern Europe In Labor Force | Age 20-64 Correlation Chart
The statistical analysis conducted on geographies consisting of 363,253,233 people shows a mild positive correlation between the proportion of Peruvians and labor force participation rate among population between the ages 20 and 64 in the United States with a correlation coefficient (R) of 0.349 and weighted average of 80.3%. Similarly, the statistical analysis conducted on geographies consisting of 402,797,252 people shows a mild positive correlation between the proportion of Immigrants from Southern Europe and labor force participation rate among population between the ages 20 and 64 in the United States with a correlation coefficient (R) of 0.389 and weighted average of 79.8%, a difference of 0.68%.
In Labor Force | Age 20-64 Correlation Summary
| Measurement | Peruvian | Immigrants from Southern Europe |
| Minimum | 55.3% | 61.4% |
| Maximum | 100.0% | 100.0% |
| Range | 44.7% | 38.6% |
| Mean | 80.8% | 79.0% |
| Median | 81.1% | 79.0% |
| Interquartile 25% (IQ1) | 79.2% | 75.4% |
| Interquartile 75% (IQ3) | 82.8% | 80.9% |
| Interquartile Range (IQR) | 3.6% | 5.5% |
| Standard Deviation (Sample) | 7.2% | 7.4% |
| Standard Deviation (Population) | 7.2% | 7.3% |
Similar Demographics by In Labor Force | Age 20-64
Demographics Similar to Peruvians by In Labor Force | Age 20-64
In terms of in labor force | age 20-64, the demographic groups most similar to Peruvians are Immigrants from Peru (80.3%, a difference of 0.010%), Immigrants from Cabo Verde (80.3%, a difference of 0.020%), Turkish (80.3%, a difference of 0.030%), Immigrants from Sri Lanka (80.4%, a difference of 0.040%), and Immigrants from Northern Africa (80.3%, a difference of 0.040%).
| Demographics | Rating | Rank | In Labor Force | Age 20-64 |
| Immigrants | Africa | 99.6 /100 | #47 | Exceptional 80.4% |
| Immigrants | Hong Kong | 99.5 /100 | #48 | Exceptional 80.4% |
| Immigrants | Greece | 99.4 /100 | #49 | Exceptional 80.4% |
| Immigrants | Sudan | 99.4 /100 | #50 | Exceptional 80.4% |
| Immigrants | Sri Lanka | 99.3 /100 | #51 | Exceptional 80.4% |
| Turks | 99.2 /100 | #52 | Exceptional 80.3% |
| Immigrants | Peru | 99.2 /100 | #53 | Exceptional 80.3% |
| Peruvians | 99.1 /100 | #54 | Exceptional 80.3% |
| Immigrants | Cabo Verde | 99.0 /100 | #55 | Exceptional 80.3% |
| Immigrants | Northern Africa | 99.0 /100 | #56 | Exceptional 80.3% |
| Afghans | 98.9 /100 | #57 | Exceptional 80.3% |
| Serbians | 98.9 /100 | #58 | Exceptional 80.3% |
| Swedes | 98.9 /100 | #59 | Exceptional 80.3% |
| Tongans | 98.8 /100 | #60 | Exceptional 80.3% |
| Burmese | 98.8 /100 | #61 | Exceptional 80.3% |
Demographics Similar to Immigrants from Southern Europe by In Labor Force | Age 20-64
In terms of in labor force | age 20-64, the demographic groups most similar to Immigrants from Southern Europe are Pakistani (79.8%, a difference of 0.0%), Immigrants from Israel (79.8%, a difference of 0.010%), Slovak (79.8%, a difference of 0.010%), Immigrants from Sweden (79.8%, a difference of 0.010%), and Korean (79.8%, a difference of 0.010%).
| Demographics | Rating | Rank | In Labor Force | Age 20-64 |
| Immigrants | Spain | 83.9 /100 | #139 | Excellent 79.8% |
| Immigrants | South Eastern Asia | 80.4 /100 | #140 | Excellent 79.8% |
| Immigrants | Israel | 80.0 /100 | #141 | Good 79.8% |
| Slovaks | 79.9 /100 | #142 | Good 79.8% |
| Immigrants | Sweden | 79.7 /100 | #143 | Good 79.8% |
| Koreans | 79.6 /100 | #144 | Good 79.8% |
| Pakistanis | 79.3 /100 | #145 | Good 79.8% |
| Immigrants | Southern Europe | 78.9 /100 | #146 | Good 79.8% |
| Immigrants | Philippines | 78.0 /100 | #147 | Good 79.8% |
| Romanians | 77.6 /100 | #148 | Good 79.8% |
| Icelanders | 75.1 /100 | #149 | Good 79.7% |
| Costa Ricans | 72.4 /100 | #150 | Good 79.7% |
| Scandinavians | 72.0 /100 | #151 | Good 79.7% |
| Immigrants | Northern Europe | 72.0 /100 | #152 | Good 79.7% |
| Immigrants | Kazakhstan | 69.5 /100 | #153 | Good 79.7% |