Ecuadorian vs Immigrants from Belize In Labor Force | Age 35-44
COMPARE
Ecuadorian
Immigrants from Belize
In Labor Force | Age 35-44
In Labor Force | Age 35-44 Comparison
Ecuadorians
Immigrants from Belize
84.2%
IN LABOR FORCE | AGE 35-44
24.0/ 100
METRIC RATING
198th/ 347
METRIC RANK
82.9%
IN LABOR FORCE | AGE 35-44
0.0/ 100
METRIC RATING
287th/ 347
METRIC RANK
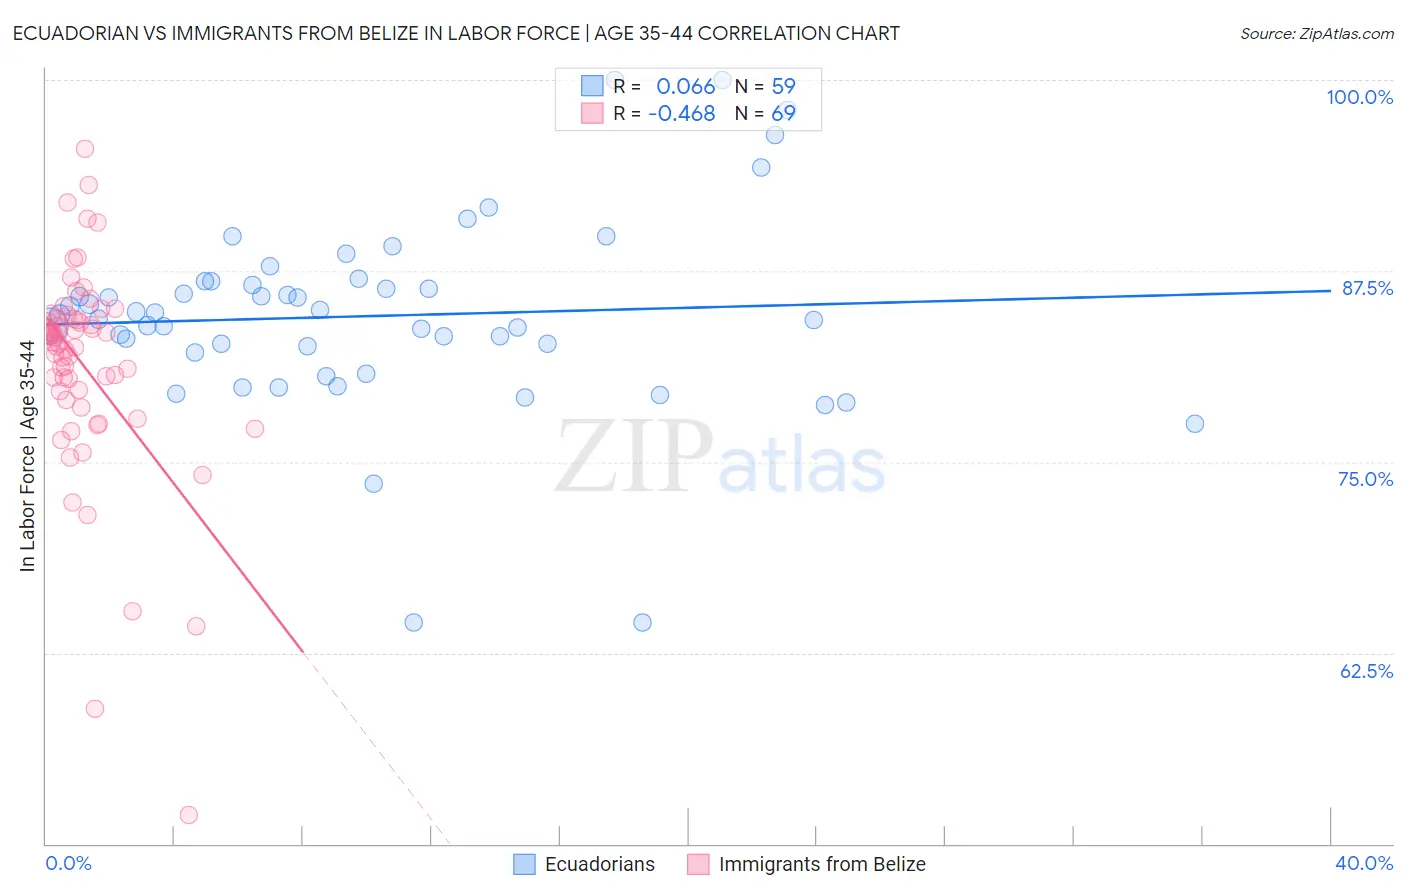
Ecuadorian vs Immigrants from Belize In Labor Force | Age 35-44 Correlation Chart
The statistical analysis conducted on geographies consisting of 317,693,933 people shows a slight positive correlation between the proportion of Ecuadorians and labor force participation rate among population between the ages 35 and 44 in the United States with a correlation coefficient (R) of 0.066 and weighted average of 84.2%. Similarly, the statistical analysis conducted on geographies consisting of 130,306,944 people shows a moderate negative correlation between the proportion of Immigrants from Belize and labor force participation rate among population between the ages 35 and 44 in the United States with a correlation coefficient (R) of -0.468 and weighted average of 82.9%, a difference of 1.5%.
In Labor Force | Age 35-44 Correlation Summary
| Measurement | Ecuadorian | Immigrants from Belize |
| Minimum | 64.5% | 51.9% |
| Maximum | 100.0% | 95.5% |
| Range | 35.5% | 43.6% |
| Mean | 84.6% | 81.3% |
| Median | 84.6% | 82.8% |
| Interquartile 25% (IQ1) | 82.1% | 79.3% |
| Interquartile 75% (IQ3) | 86.8% | 84.4% |
| Interquartile Range (IQR) | 4.7% | 5.1% |
| Standard Deviation (Sample) | 6.4% | 7.0% |
| Standard Deviation (Population) | 6.3% | 7.0% |
Similar Demographics by In Labor Force | Age 35-44
Demographics Similar to Ecuadorians by In Labor Force | Age 35-44
In terms of in labor force | age 35-44, the demographic groups most similar to Ecuadorians are Immigrants from Caribbean (84.2%, a difference of 0.010%), Immigrants from England (84.2%, a difference of 0.010%), Immigrants from Western Europe (84.2%, a difference of 0.010%), Syrian (84.2%, a difference of 0.010%), and Moroccan (84.2%, a difference of 0.010%).
| Demographics | Rating | Rank | In Labor Force | Age 35-44 |
| Immigrants | Philippines | 27.9 /100 | #191 | Fair 84.2% |
| Immigrants | Vietnam | 27.4 /100 | #192 | Fair 84.2% |
| Hungarians | 26.8 /100 | #193 | Fair 84.2% |
| Immigrants | Indonesia | 25.7 /100 | #194 | Fair 84.2% |
| Immigrants | Caribbean | 25.7 /100 | #195 | Fair 84.2% |
| Immigrants | England | 25.0 /100 | #196 | Fair 84.2% |
| Immigrants | Western Europe | 24.7 /100 | #197 | Fair 84.2% |
| Ecuadorians | 24.0 /100 | #198 | Fair 84.2% |
| Syrians | 23.2 /100 | #199 | Fair 84.2% |
| Moroccans | 23.2 /100 | #200 | Fair 84.2% |
| British | 23.0 /100 | #201 | Fair 84.2% |
| Immigrants | Uzbekistan | 22.8 /100 | #202 | Fair 84.2% |
| Immigrants | South Eastern Asia | 22.4 /100 | #203 | Fair 84.2% |
| Canadians | 19.9 /100 | #204 | Poor 84.2% |
| Immigrants | Canada | 19.6 /100 | #205 | Poor 84.2% |
Demographics Similar to Immigrants from Belize by In Labor Force | Age 35-44
In terms of in labor force | age 35-44, the demographic groups most similar to Immigrants from Belize are Fijian (82.9%, a difference of 0.0%), Immigrants from Bangladesh (82.9%, a difference of 0.0%), Immigrants from Dominican Republic (82.9%, a difference of 0.020%), Puget Sound Salish (82.9%, a difference of 0.020%), and Osage (82.9%, a difference of 0.030%).
| Demographics | Rating | Rank | In Labor Force | Age 35-44 |
| Dominicans | 0.0 /100 | #280 | Tragic 83.1% |
| Guatemalans | 0.0 /100 | #281 | Tragic 83.0% |
| Osage | 0.0 /100 | #282 | Tragic 82.9% |
| Immigrants | Guatemala | 0.0 /100 | #283 | Tragic 82.9% |
| Immigrants | Dominican Republic | 0.0 /100 | #284 | Tragic 82.9% |
| Fijians | 0.0 /100 | #285 | Tragic 82.9% |
| Immigrants | Bangladesh | 0.0 /100 | #286 | Tragic 82.9% |
| Immigrants | Belize | 0.0 /100 | #287 | Tragic 82.9% |
| Puget Sound Salish | 0.0 /100 | #288 | Tragic 82.9% |
| Chippewa | 0.0 /100 | #289 | Tragic 82.9% |
| Africans | 0.0 /100 | #290 | Tragic 82.9% |
| Pennsylvania Germans | 0.0 /100 | #291 | Tragic 82.9% |
| Immigrants | Latin America | 0.0 /100 | #292 | Tragic 82.8% |
| Spanish Americans | 0.0 /100 | #293 | Tragic 82.8% |
| Potawatomi | 0.0 /100 | #294 | Tragic 82.7% |