Immigrants from Cameroon vs Immigrants from Belize In Labor Force | Age 35-44
COMPARE
Immigrants from Cameroon
Immigrants from Belize
In Labor Force | Age 35-44
In Labor Force | Age 35-44 Comparison
Immigrants from Cameroon
Immigrants from Belize
85.8%
IN LABOR FORCE | AGE 35-44
100.0/ 100
METRIC RATING
11th/ 347
METRIC RANK
82.9%
IN LABOR FORCE | AGE 35-44
0.0/ 100
METRIC RATING
287th/ 347
METRIC RANK
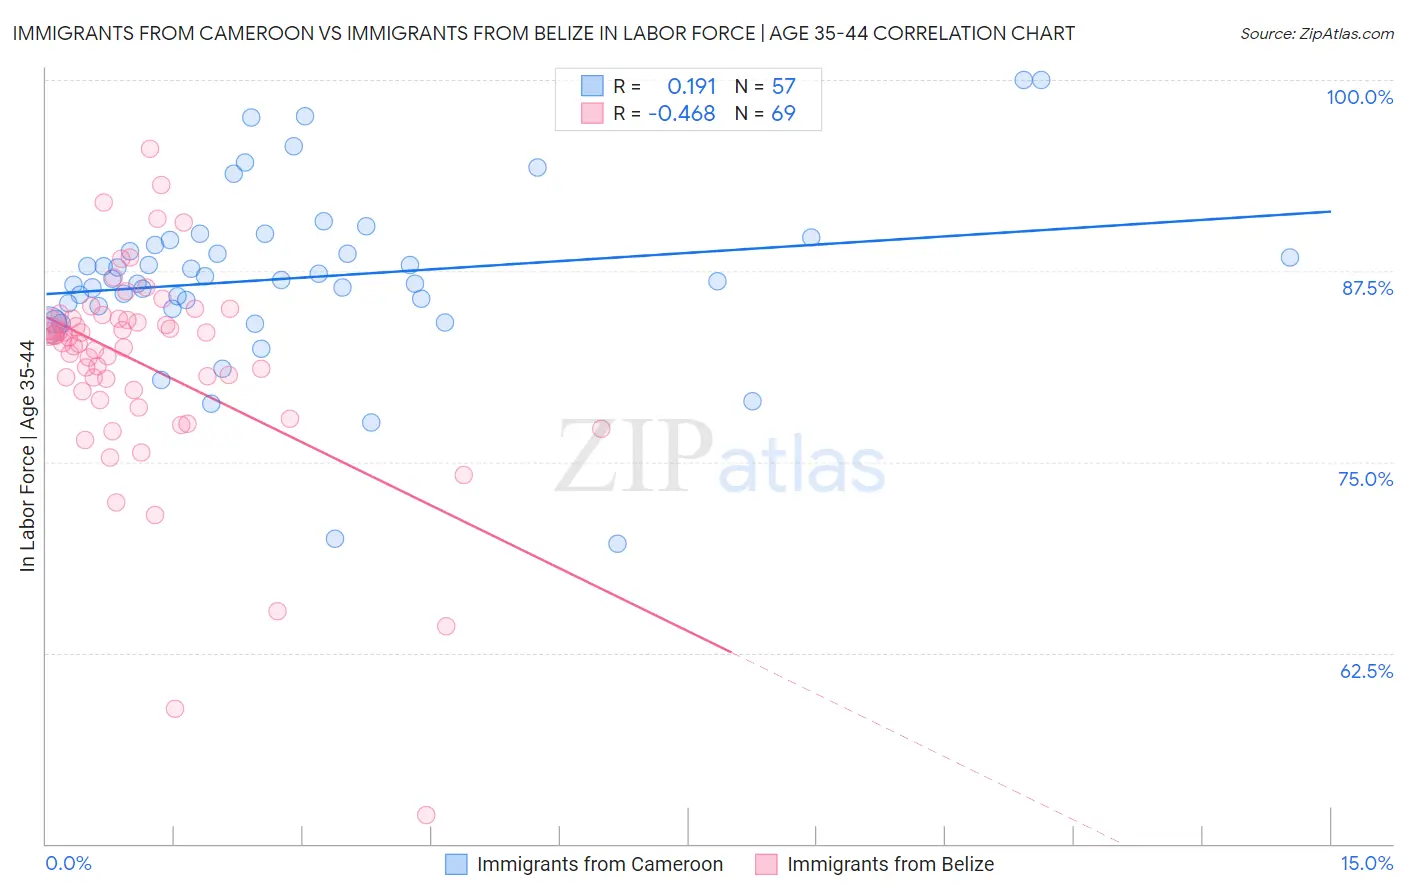
Immigrants from Cameroon vs Immigrants from Belize In Labor Force | Age 35-44 Correlation Chart
The statistical analysis conducted on geographies consisting of 130,741,497 people shows a poor positive correlation between the proportion of Immigrants from Cameroon and labor force participation rate among population between the ages 35 and 44 in the United States with a correlation coefficient (R) of 0.191 and weighted average of 85.8%. Similarly, the statistical analysis conducted on geographies consisting of 130,306,944 people shows a moderate negative correlation between the proportion of Immigrants from Belize and labor force participation rate among population between the ages 35 and 44 in the United States with a correlation coefficient (R) of -0.468 and weighted average of 82.9%, a difference of 3.4%.
In Labor Force | Age 35-44 Correlation Summary
| Measurement | Immigrants from Cameroon | Immigrants from Belize |
| Minimum | 69.6% | 51.9% |
| Maximum | 100.0% | 95.5% |
| Range | 30.4% | 43.6% |
| Mean | 87.1% | 81.3% |
| Median | 86.9% | 82.8% |
| Interquartile 25% (IQ1) | 85.1% | 79.3% |
| Interquartile 75% (IQ3) | 89.3% | 84.4% |
| Interquartile Range (IQR) | 4.2% | 5.1% |
| Standard Deviation (Sample) | 5.7% | 7.0% |
| Standard Deviation (Population) | 5.7% | 7.0% |
Similar Demographics by In Labor Force | Age 35-44
Demographics Similar to Immigrants from Cameroon by In Labor Force | Age 35-44
In terms of in labor force | age 35-44, the demographic groups most similar to Immigrants from Cameroon are Cape Verdean (85.8%, a difference of 0.030%), Liberian (85.7%, a difference of 0.12%), Somali (85.6%, a difference of 0.14%), Immigrants from Somalia (85.6%, a difference of 0.14%), and Immigrants from Ethiopia (85.9%, a difference of 0.16%).
| Demographics | Rating | Rank | In Labor Force | Age 35-44 |
| Immigrants | Cabo Verde | 100.0 /100 | #4 | Exceptional 86.2% |
| Zimbabweans | 100.0 /100 | #5 | Exceptional 86.1% |
| Bolivians | 100.0 /100 | #6 | Exceptional 86.1% |
| Immigrants | Sierra Leone | 100.0 /100 | #7 | Exceptional 86.1% |
| Immigrants | Ethiopia | 100.0 /100 | #8 | Exceptional 85.9% |
| Ethiopians | 100.0 /100 | #9 | Exceptional 85.9% |
| Cape Verdeans | 100.0 /100 | #10 | Exceptional 85.8% |
| Immigrants | Cameroon | 100.0 /100 | #11 | Exceptional 85.8% |
| Liberians | 100.0 /100 | #12 | Exceptional 85.7% |
| Somalis | 100.0 /100 | #13 | Exceptional 85.6% |
| Immigrants | Somalia | 100.0 /100 | #14 | Exceptional 85.6% |
| Norwegians | 100.0 /100 | #15 | Exceptional 85.6% |
| Immigrants | Ireland | 100.0 /100 | #16 | Exceptional 85.6% |
| Immigrants | North Macedonia | 100.0 /100 | #17 | Exceptional 85.6% |
| Carpatho Rusyns | 100.0 /100 | #18 | Exceptional 85.6% |
Demographics Similar to Immigrants from Belize by In Labor Force | Age 35-44
In terms of in labor force | age 35-44, the demographic groups most similar to Immigrants from Belize are Fijian (82.9%, a difference of 0.0%), Immigrants from Bangladesh (82.9%, a difference of 0.0%), Immigrants from Dominican Republic (82.9%, a difference of 0.020%), Puget Sound Salish (82.9%, a difference of 0.020%), and Osage (82.9%, a difference of 0.030%).
| Demographics | Rating | Rank | In Labor Force | Age 35-44 |
| Dominicans | 0.0 /100 | #280 | Tragic 83.1% |
| Guatemalans | 0.0 /100 | #281 | Tragic 83.0% |
| Osage | 0.0 /100 | #282 | Tragic 82.9% |
| Immigrants | Guatemala | 0.0 /100 | #283 | Tragic 82.9% |
| Immigrants | Dominican Republic | 0.0 /100 | #284 | Tragic 82.9% |
| Fijians | 0.0 /100 | #285 | Tragic 82.9% |
| Immigrants | Bangladesh | 0.0 /100 | #286 | Tragic 82.9% |
| Immigrants | Belize | 0.0 /100 | #287 | Tragic 82.9% |
| Puget Sound Salish | 0.0 /100 | #288 | Tragic 82.9% |
| Chippewa | 0.0 /100 | #289 | Tragic 82.9% |
| Africans | 0.0 /100 | #290 | Tragic 82.9% |
| Pennsylvania Germans | 0.0 /100 | #291 | Tragic 82.9% |
| Immigrants | Latin America | 0.0 /100 | #292 | Tragic 82.8% |
| Spanish Americans | 0.0 /100 | #293 | Tragic 82.8% |
| Potawatomi | 0.0 /100 | #294 | Tragic 82.7% |