Peruvian vs English In Labor Force | Age 35-44
COMPARE
Peruvian
English
In Labor Force | Age 35-44
In Labor Force | Age 35-44 Comparison
Peruvians
English
84.9%
IN LABOR FORCE | AGE 35-44
98.3/ 100
METRIC RATING
79th/ 347
METRIC RANK
83.8%
IN LABOR FORCE | AGE 35-44
1.8/ 100
METRIC RATING
237th/ 347
METRIC RANK
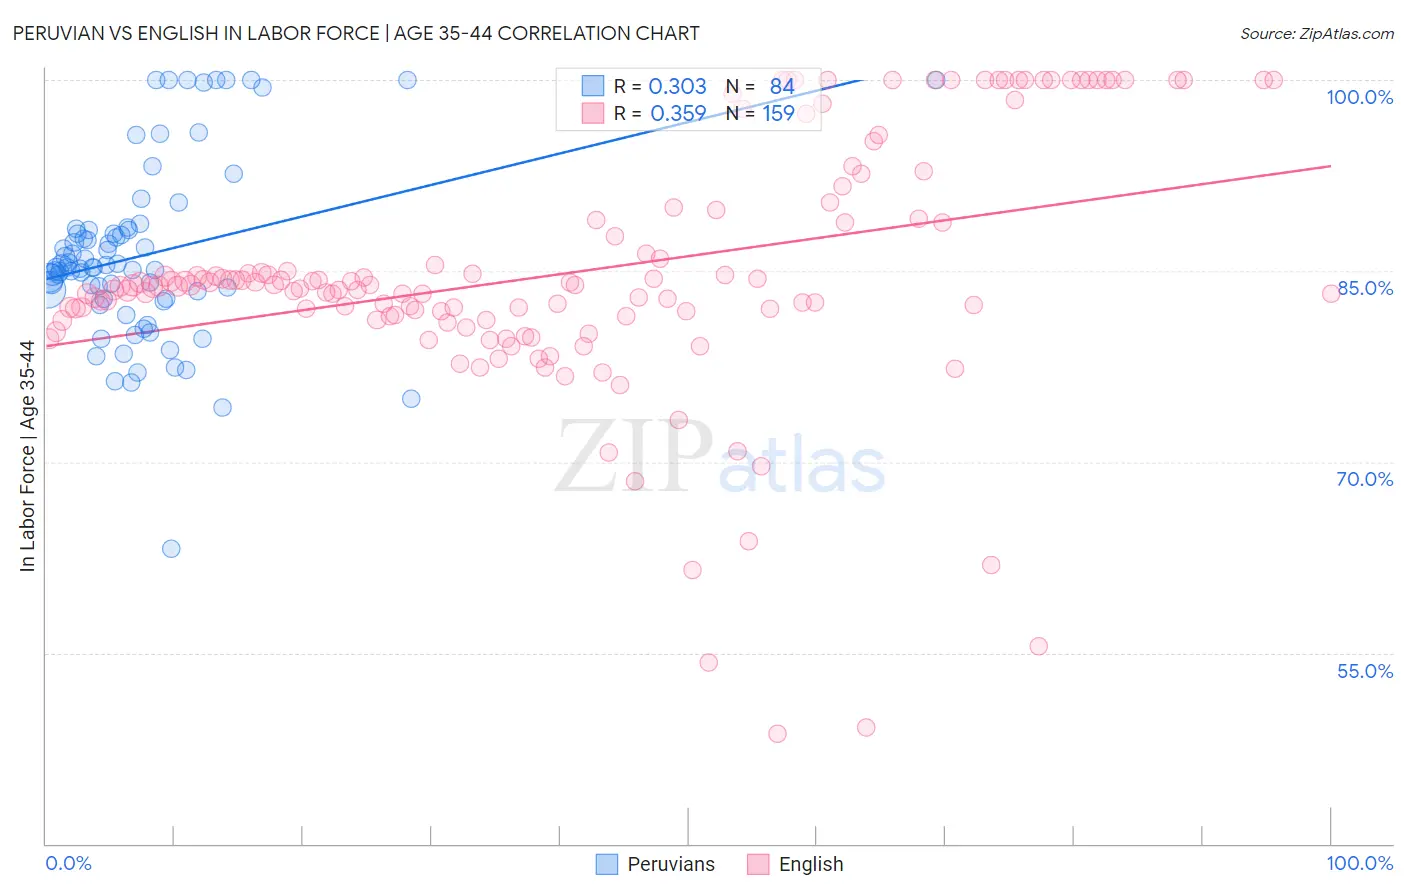
Peruvian vs English In Labor Force | Age 35-44 Correlation Chart
The statistical analysis conducted on geographies consisting of 363,043,294 people shows a mild positive correlation between the proportion of Peruvians and labor force participation rate among population between the ages 35 and 44 in the United States with a correlation coefficient (R) of 0.303 and weighted average of 84.9%. Similarly, the statistical analysis conducted on geographies consisting of 578,949,713 people shows a mild positive correlation between the proportion of English and labor force participation rate among population between the ages 35 and 44 in the United States with a correlation coefficient (R) of 0.359 and weighted average of 83.8%, a difference of 1.3%.
In Labor Force | Age 35-44 Correlation Summary
| Measurement | Peruvian | English |
| Minimum | 63.1% | 48.7% |
| Maximum | 100.0% | 100.0% |
| Range | 36.9% | 51.3% |
| Mean | 86.2% | 84.9% |
| Median | 85.3% | 83.8% |
| Interquartile 25% (IQ1) | 82.8% | 81.5% |
| Interquartile 75% (IQ3) | 88.2% | 89.1% |
| Interquartile Range (IQR) | 5.4% | 7.7% |
| Standard Deviation (Sample) | 7.0% | 9.9% |
| Standard Deviation (Population) | 7.0% | 9.8% |
Similar Demographics by In Labor Force | Age 35-44
Demographics Similar to Peruvians by In Labor Force | Age 35-44
In terms of in labor force | age 35-44, the demographic groups most similar to Peruvians are Immigrants from Africa (84.9%, a difference of 0.0%), Immigrants from Colombia (84.9%, a difference of 0.0%), Immigrants from Eastern Europe (84.9%, a difference of 0.0%), Immigrants from Sudan (84.9%, a difference of 0.020%), and Immigrants from Cuba (84.9%, a difference of 0.030%).
| Demographics | Rating | Rank | In Labor Force | Age 35-44 |
| Immigrants | Singapore | 98.9 /100 | #72 | Exceptional 85.0% |
| Immigrants | Sri Lanka | 98.9 /100 | #73 | Exceptional 85.0% |
| Colombians | 98.8 /100 | #74 | Exceptional 85.0% |
| Immigrants | South Central Asia | 98.7 /100 | #75 | Exceptional 85.0% |
| Immigrants | Cuba | 98.6 /100 | #76 | Exceptional 84.9% |
| Immigrants | Turkey | 98.6 /100 | #77 | Exceptional 84.9% |
| Immigrants | Africa | 98.4 /100 | #78 | Exceptional 84.9% |
| Peruvians | 98.3 /100 | #79 | Exceptional 84.9% |
| Immigrants | Colombia | 98.3 /100 | #80 | Exceptional 84.9% |
| Immigrants | Eastern Europe | 98.3 /100 | #81 | Exceptional 84.9% |
| Immigrants | Sudan | 98.1 /100 | #82 | Exceptional 84.9% |
| Senegalese | 97.8 /100 | #83 | Exceptional 84.9% |
| Immigrants | Peru | 97.8 /100 | #84 | Exceptional 84.9% |
| Immigrants | Middle Africa | 97.8 /100 | #85 | Exceptional 84.9% |
| Greeks | 97.8 /100 | #86 | Exceptional 84.9% |
Demographics Similar to English by In Labor Force | Age 35-44
In terms of in labor force | age 35-44, the demographic groups most similar to English are Immigrants from Laos (83.8%, a difference of 0.020%), West Indian (83.9%, a difference of 0.040%), Immigrants from Syria (83.9%, a difference of 0.050%), Celtic (83.8%, a difference of 0.050%), and Arab (83.8%, a difference of 0.050%).
| Demographics | Rating | Rank | In Labor Force | Age 35-44 |
| Immigrants | Iraq | 3.7 /100 | #230 | Tragic 83.9% |
| Scottish | 3.2 /100 | #231 | Tragic 83.9% |
| Native Hawaiians | 3.0 /100 | #232 | Tragic 83.9% |
| Immigrants | Germany | 2.8 /100 | #233 | Tragic 83.9% |
| Immigrants | Oceania | 2.6 /100 | #234 | Tragic 83.9% |
| Immigrants | Syria | 2.5 /100 | #235 | Tragic 83.9% |
| West Indians | 2.4 /100 | #236 | Tragic 83.9% |
| English | 1.8 /100 | #237 | Tragic 83.8% |
| Immigrants | Laos | 1.7 /100 | #238 | Tragic 83.8% |
| Celtics | 1.4 /100 | #239 | Tragic 83.8% |
| Arabs | 1.3 /100 | #240 | Tragic 83.8% |
| Iraqis | 1.3 /100 | #241 | Tragic 83.8% |
| Immigrants | Cambodia | 1.1 /100 | #242 | Tragic 83.8% |
| Immigrants | Western Asia | 1.1 /100 | #243 | Tragic 83.8% |
| Guyanese | 1.1 /100 | #244 | Tragic 83.8% |