Pennsylvania German vs Immigrants from Uganda In Labor Force | Age 25-29
COMPARE
Pennsylvania German
Immigrants from Uganda
In Labor Force | Age 25-29
In Labor Force | Age 25-29 Comparison
Pennsylvania Germans
Immigrants from Uganda
83.6%
IN LABOR FORCE | AGE 25-29
0.1/ 100
METRIC RATING
261st/ 347
METRIC RANK
86.0%
IN LABOR FORCE | AGE 25-29
100.0/ 100
METRIC RATING
23rd/ 347
METRIC RANK
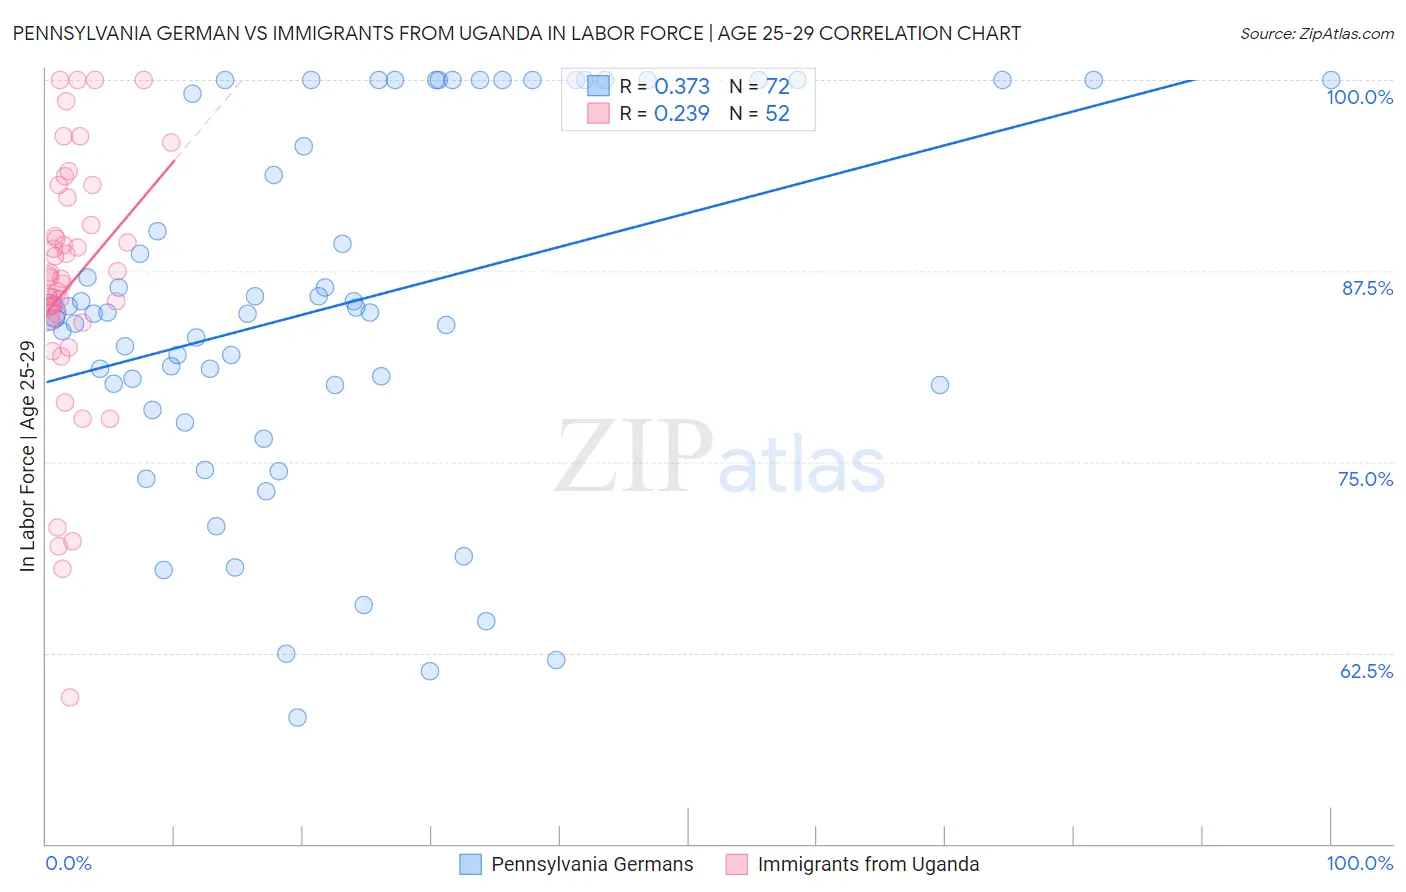
Pennsylvania German vs Immigrants from Uganda In Labor Force | Age 25-29 Correlation Chart
The statistical analysis conducted on geographies consisting of 234,004,044 people shows a mild positive correlation between the proportion of Pennsylvania Germans and labor force participation rate among population between the ages 25 and 29 in the United States with a correlation coefficient (R) of 0.373 and weighted average of 83.6%. Similarly, the statistical analysis conducted on geographies consisting of 125,979,949 people shows a weak positive correlation between the proportion of Immigrants from Uganda and labor force participation rate among population between the ages 25 and 29 in the United States with a correlation coefficient (R) of 0.239 and weighted average of 86.0%, a difference of 2.8%.
In Labor Force | Age 25-29 Correlation Summary
| Measurement | Pennsylvania German | Immigrants from Uganda |
| Minimum | 58.3% | 59.6% |
| Maximum | 100.0% | 100.0% |
| Range | 41.7% | 40.4% |
| Mean | 85.3% | 86.7% |
| Median | 84.8% | 87.0% |
| Interquartile 25% (IQ1) | 80.0% | 84.5% |
| Interquartile 75% (IQ3) | 100.0% | 91.4% |
| Interquartile Range (IQR) | 20.0% | 6.9% |
| Standard Deviation (Sample) | 11.7% | 8.4% |
| Standard Deviation (Population) | 11.6% | 8.4% |
Similar Demographics by In Labor Force | Age 25-29
Demographics Similar to Pennsylvania Germans by In Labor Force | Age 25-29
In terms of in labor force | age 25-29, the demographic groups most similar to Pennsylvania Germans are Immigrants from Bahamas (83.6%, a difference of 0.0%), Spanish (83.6%, a difference of 0.010%), Immigrants from Guatemala (83.6%, a difference of 0.020%), Delaware (83.7%, a difference of 0.060%), and Immigrants from Fiji (83.6%, a difference of 0.060%).
| Demographics | Rating | Rank | In Labor Force | Age 25-29 |
| Spaniards | 0.2 /100 | #254 | Tragic 83.7% |
| Haitians | 0.2 /100 | #255 | Tragic 83.7% |
| Immigrants | Haiti | 0.2 /100 | #256 | Tragic 83.7% |
| Delaware | 0.2 /100 | #257 | Tragic 83.7% |
| Immigrants | Guatemala | 0.1 /100 | #258 | Tragic 83.6% |
| Spanish | 0.1 /100 | #259 | Tragic 83.6% |
| Immigrants | Bahamas | 0.1 /100 | #260 | Tragic 83.6% |
| Pennsylvania Germans | 0.1 /100 | #261 | Tragic 83.6% |
| Immigrants | Fiji | 0.1 /100 | #262 | Tragic 83.6% |
| West Indians | 0.1 /100 | #263 | Tragic 83.5% |
| Puget Sound Salish | 0.1 /100 | #264 | Tragic 83.5% |
| Cubans | 0.1 /100 | #265 | Tragic 83.5% |
| Aleuts | 0.0 /100 | #266 | Tragic 83.4% |
| Spanish Americans | 0.0 /100 | #267 | Tragic 83.4% |
| Immigrants | Lebanon | 0.0 /100 | #268 | Tragic 83.4% |
Demographics Similar to Immigrants from Uganda by In Labor Force | Age 25-29
In terms of in labor force | age 25-29, the demographic groups most similar to Immigrants from Uganda are Immigrants from Eastern Africa (86.0%, a difference of 0.010%), Cambodian (86.0%, a difference of 0.020%), Sudanese (85.9%, a difference of 0.020%), Maltese (86.0%, a difference of 0.030%), and Immigrants from Ireland (86.0%, a difference of 0.040%).
| Demographics | Rating | Rank | In Labor Force | Age 25-29 |
| Immigrants | Bolivia | 100.0 /100 | #16 | Exceptional 86.1% |
| Bermudans | 100.0 /100 | #17 | Exceptional 86.0% |
| Bulgarians | 100.0 /100 | #18 | Exceptional 86.0% |
| Cape Verdeans | 100.0 /100 | #19 | Exceptional 86.0% |
| Immigrants | Ireland | 100.0 /100 | #20 | Exceptional 86.0% |
| Maltese | 100.0 /100 | #21 | Exceptional 86.0% |
| Cambodians | 100.0 /100 | #22 | Exceptional 86.0% |
| Immigrants | Uganda | 100.0 /100 | #23 | Exceptional 86.0% |
| Immigrants | Eastern Africa | 100.0 /100 | #24 | Exceptional 86.0% |
| Sudanese | 100.0 /100 | #25 | Exceptional 85.9% |
| Immigrants | North Macedonia | 100.0 /100 | #26 | Exceptional 85.9% |
| Paraguayans | 100.0 /100 | #27 | Exceptional 85.9% |
| Ugandans | 100.0 /100 | #28 | Exceptional 85.9% |
| Immigrants | Liberia | 100.0 /100 | #29 | Exceptional 85.9% |
| Immigrants | Serbia | 100.0 /100 | #30 | Exceptional 85.9% |