Pennsylvania German vs Immigrants from El Salvador In Labor Force | Age 25-29
COMPARE
Pennsylvania German
Immigrants from El Salvador
In Labor Force | Age 25-29
In Labor Force | Age 25-29 Comparison
Pennsylvania Germans
Immigrants from El Salvador
83.6%
IN LABOR FORCE | AGE 25-29
0.1/ 100
METRIC RATING
261st/ 347
METRIC RANK
83.7%
IN LABOR FORCE | AGE 25-29
0.3/ 100
METRIC RATING
247th/ 347
METRIC RANK
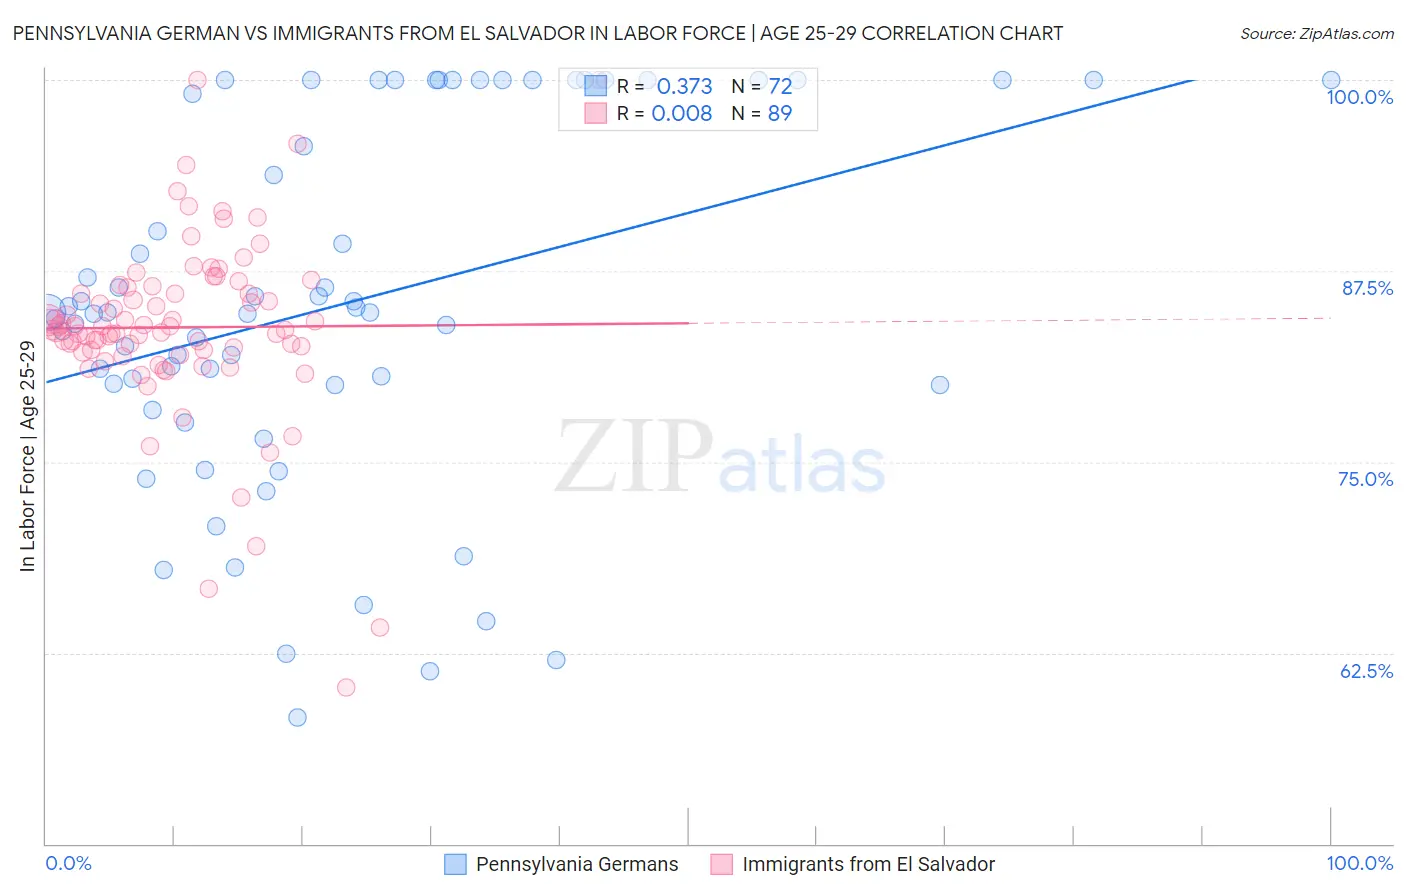
Pennsylvania German vs Immigrants from El Salvador In Labor Force | Age 25-29 Correlation Chart
The statistical analysis conducted on geographies consisting of 234,004,044 people shows a mild positive correlation between the proportion of Pennsylvania Germans and labor force participation rate among population between the ages 25 and 29 in the United States with a correlation coefficient (R) of 0.373 and weighted average of 83.6%. Similarly, the statistical analysis conducted on geographies consisting of 357,714,097 people shows no correlation between the proportion of Immigrants from El Salvador and labor force participation rate among population between the ages 25 and 29 in the United States with a correlation coefficient (R) of 0.008 and weighted average of 83.7%, a difference of 0.16%.
In Labor Force | Age 25-29 Correlation Summary
| Measurement | Pennsylvania German | Immigrants from El Salvador |
| Minimum | 58.3% | 60.2% |
| Maximum | 100.0% | 100.0% |
| Range | 41.7% | 39.8% |
| Mean | 85.3% | 83.8% |
| Median | 84.8% | 83.6% |
| Interquartile 25% (IQ1) | 80.0% | 82.2% |
| Interquartile 75% (IQ3) | 100.0% | 86.5% |
| Interquartile Range (IQR) | 20.0% | 4.2% |
| Standard Deviation (Sample) | 11.7% | 6.0% |
| Standard Deviation (Population) | 11.6% | 6.0% |
Demographics Similar to Pennsylvania Germans and Immigrants from El Salvador by In Labor Force | Age 25-29
In terms of in labor force | age 25-29, the demographic groups most similar to Pennsylvania Germans are Immigrants from Bahamas (83.6%, a difference of 0.0%), Spanish (83.6%, a difference of 0.010%), Immigrants from Guatemala (83.6%, a difference of 0.020%), Delaware (83.7%, a difference of 0.060%), and Immigrants from Fiji (83.6%, a difference of 0.060%). Similarly, the demographic groups most similar to Immigrants from El Salvador are Cree (83.8%, a difference of 0.020%), Nonimmigrants (83.7%, a difference of 0.020%), Hmong (83.7%, a difference of 0.030%), Central American (83.7%, a difference of 0.040%), and Bahamian (83.7%, a difference of 0.060%).
| Demographics | Rating | Rank | In Labor Force | Age 25-29 |
| Immigrants | Jamaica | 0.4 /100 | #244 | Tragic 83.8% |
| Iroquois | 0.4 /100 | #245 | Tragic 83.8% |
| Cree | 0.3 /100 | #246 | Tragic 83.8% |
| Immigrants | El Salvador | 0.3 /100 | #247 | Tragic 83.7% |
| Immigrants | Nonimmigrants | 0.3 /100 | #248 | Tragic 83.7% |
| Hmong | 0.3 /100 | #249 | Tragic 83.7% |
| Central Americans | 0.2 /100 | #250 | Tragic 83.7% |
| Bahamians | 0.2 /100 | #251 | Tragic 83.7% |
| Guatemalans | 0.2 /100 | #252 | Tragic 83.7% |
| Immigrants | Trinidad and Tobago | 0.2 /100 | #253 | Tragic 83.7% |
| Spaniards | 0.2 /100 | #254 | Tragic 83.7% |
| Haitians | 0.2 /100 | #255 | Tragic 83.7% |
| Immigrants | Haiti | 0.2 /100 | #256 | Tragic 83.7% |
| Delaware | 0.2 /100 | #257 | Tragic 83.7% |
| Immigrants | Guatemala | 0.1 /100 | #258 | Tragic 83.6% |
| Spanish | 0.1 /100 | #259 | Tragic 83.6% |
| Immigrants | Bahamas | 0.1 /100 | #260 | Tragic 83.6% |
| Pennsylvania Germans | 0.1 /100 | #261 | Tragic 83.6% |
| Immigrants | Fiji | 0.1 /100 | #262 | Tragic 83.6% |
| West Indians | 0.1 /100 | #263 | Tragic 83.5% |
| Puget Sound Salish | 0.1 /100 | #264 | Tragic 83.5% |