Paraguayan vs Immigrants from Oceania In Labor Force | Age 16-19
COMPARE
Paraguayan
Immigrants from Oceania
In Labor Force | Age 16-19
In Labor Force | Age 16-19 Comparison
Paraguayans
Immigrants from Oceania
33.8%
IN LABOR FORCE | AGE 16-19
0.3/ 100
METRIC RATING
279th/ 347
METRIC RANK
37.9%
IN LABOR FORCE | AGE 16-19
94.7/ 100
METRIC RATING
132nd/ 347
METRIC RANK
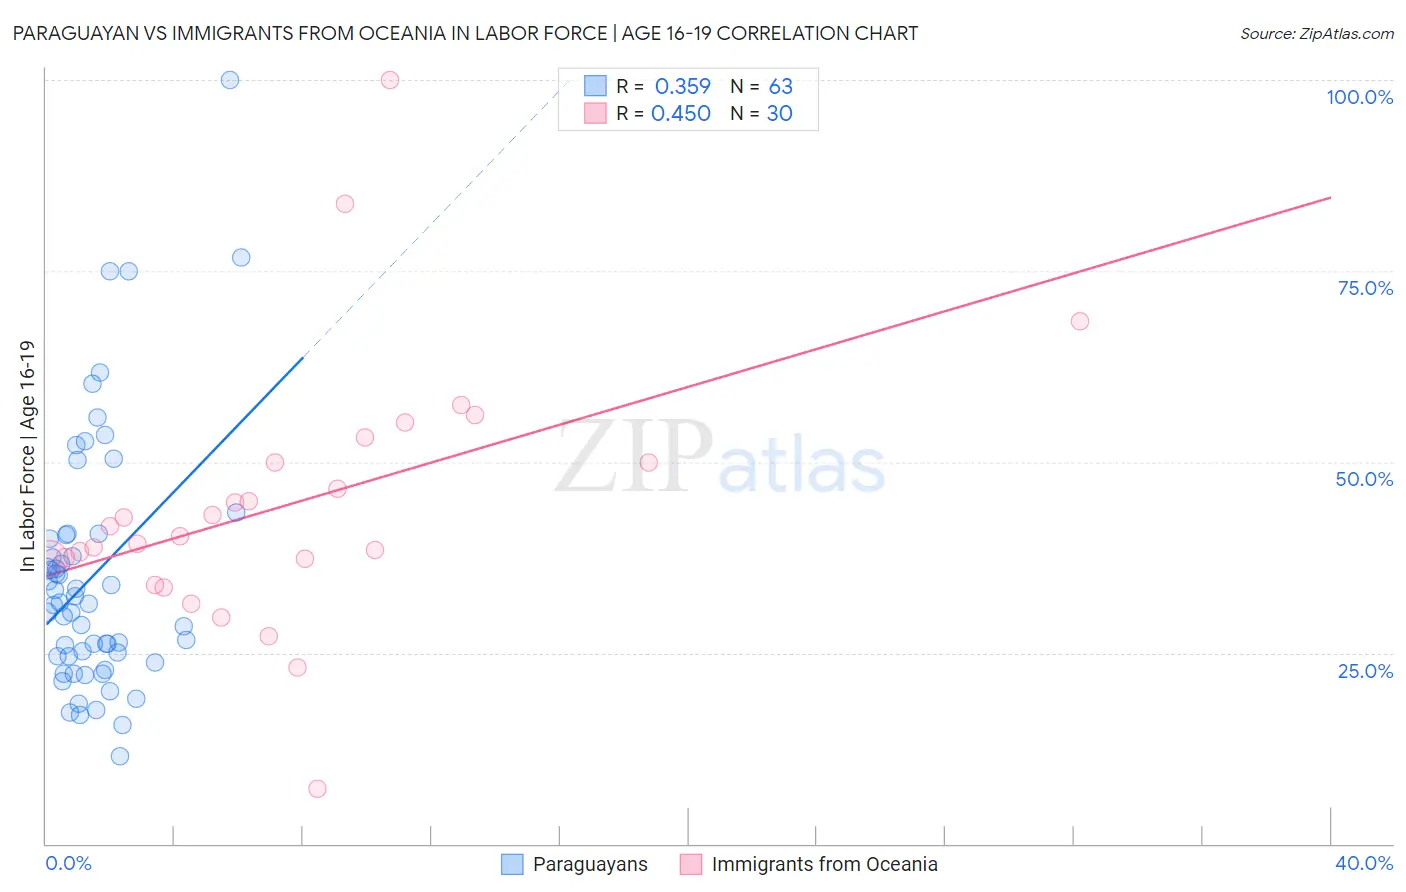
Paraguayan vs Immigrants from Oceania In Labor Force | Age 16-19 Correlation Chart
The statistical analysis conducted on geographies consisting of 95,093,714 people shows a mild positive correlation between the proportion of Paraguayans and labor force participation rate among population between the ages 16 and 19 in the United States with a correlation coefficient (R) of 0.359 and weighted average of 33.8%. Similarly, the statistical analysis conducted on geographies consisting of 305,018,730 people shows a moderate positive correlation between the proportion of Immigrants from Oceania and labor force participation rate among population between the ages 16 and 19 in the United States with a correlation coefficient (R) of 0.450 and weighted average of 37.9%, a difference of 12.0%.
In Labor Force | Age 16-19 Correlation Summary
| Measurement | Paraguayan | Immigrants from Oceania |
| Minimum | 11.4% | 7.3% |
| Maximum | 100.0% | 100.0% |
| Range | 88.6% | 92.7% |
| Mean | 35.2% | 44.3% |
| Median | 31.5% | 40.9% |
| Interquartile 25% (IQ1) | 24.5% | 37.3% |
| Interquartile 75% (IQ3) | 40.5% | 50.0% |
| Interquartile Range (IQR) | 16.0% | 12.7% |
| Standard Deviation (Sample) | 16.8% | 17.5% |
| Standard Deviation (Population) | 16.6% | 17.2% |
Similar Demographics by In Labor Force | Age 16-19
Demographics Similar to Paraguayans by In Labor Force | Age 16-19
In terms of in labor force | age 16-19, the demographic groups most similar to Paraguayans are Colombian (33.8%, a difference of 0.010%), Taiwanese (33.8%, a difference of 0.010%), Cypriot (33.8%, a difference of 0.010%), Immigrants from Korea (33.8%, a difference of 0.020%), and Menominee (33.9%, a difference of 0.080%).
| Demographics | Rating | Rank | In Labor Force | Age 16-19 |
| Asians | 0.4 /100 | #272 | Tragic 34.1% |
| Immigrants | Panama | 0.4 /100 | #273 | Tragic 34.0% |
| Venezuelans | 0.3 /100 | #274 | Tragic 34.0% |
| Immigrants | Fiji | 0.3 /100 | #275 | Tragic 33.9% |
| Immigrants | Latin America | 0.3 /100 | #276 | Tragic 33.9% |
| Menominee | 0.3 /100 | #277 | Tragic 33.9% |
| Colombians | 0.3 /100 | #278 | Tragic 33.8% |
| Paraguayans | 0.3 /100 | #279 | Tragic 33.8% |
| Taiwanese | 0.3 /100 | #280 | Tragic 33.8% |
| Cypriots | 0.3 /100 | #281 | Tragic 33.8% |
| Immigrants | Korea | 0.3 /100 | #282 | Tragic 33.8% |
| Immigrants | Venezuela | 0.2 /100 | #283 | Tragic 33.7% |
| Immigrants | Spain | 0.2 /100 | #284 | Tragic 33.7% |
| U.S. Virgin Islanders | 0.2 /100 | #285 | Tragic 33.6% |
| South Americans | 0.2 /100 | #286 | Tragic 33.6% |
Demographics Similar to Immigrants from Oceania by In Labor Force | Age 16-19
In terms of in labor force | age 16-19, the demographic groups most similar to Immigrants from Oceania are Cheyenne (37.9%, a difference of 0.020%), Immigrants from Austria (37.9%, a difference of 0.080%), Immigrants from Zimbabwe (38.0%, a difference of 0.18%), Spaniard (38.0%, a difference of 0.21%), and Choctaw (38.0%, a difference of 0.23%).
| Demographics | Rating | Rank | In Labor Force | Age 16-19 |
| Immigrants | Africa | 96.1 /100 | #125 | Exceptional 38.0% |
| Africans | 95.6 /100 | #126 | Exceptional 38.0% |
| Choctaw | 95.6 /100 | #127 | Exceptional 38.0% |
| New Zealanders | 95.6 /100 | #128 | Exceptional 38.0% |
| Spaniards | 95.5 /100 | #129 | Exceptional 38.0% |
| Immigrants | Zimbabwe | 95.4 /100 | #130 | Exceptional 38.0% |
| Immigrants | Austria | 95.0 /100 | #131 | Exceptional 37.9% |
| Immigrants | Oceania | 94.7 /100 | #132 | Exceptional 37.9% |
| Cheyenne | 94.6 /100 | #133 | Exceptional 37.9% |
| Immigrants | Netherlands | 93.7 /100 | #134 | Exceptional 37.8% |
| Macedonians | 93.4 /100 | #135 | Exceptional 37.8% |
| Australians | 93.2 /100 | #136 | Exceptional 37.8% |
| Cajuns | 93.2 /100 | #137 | Exceptional 37.8% |
| Comanche | 91.9 /100 | #138 | Exceptional 37.7% |
| Immigrants | Moldova | 91.9 /100 | #139 | Exceptional 37.7% |