Immigrants from Thailand vs Immigrants from Oceania In Labor Force | Age 16-19
COMPARE
Immigrants from Thailand
Immigrants from Oceania
In Labor Force | Age 16-19
In Labor Force | Age 16-19 Comparison
Immigrants from Thailand
Immigrants from Oceania
38.7%
IN LABOR FORCE | AGE 16-19
99.1/ 100
METRIC RATING
100th/ 347
METRIC RANK
37.9%
IN LABOR FORCE | AGE 16-19
94.7/ 100
METRIC RATING
132nd/ 347
METRIC RANK
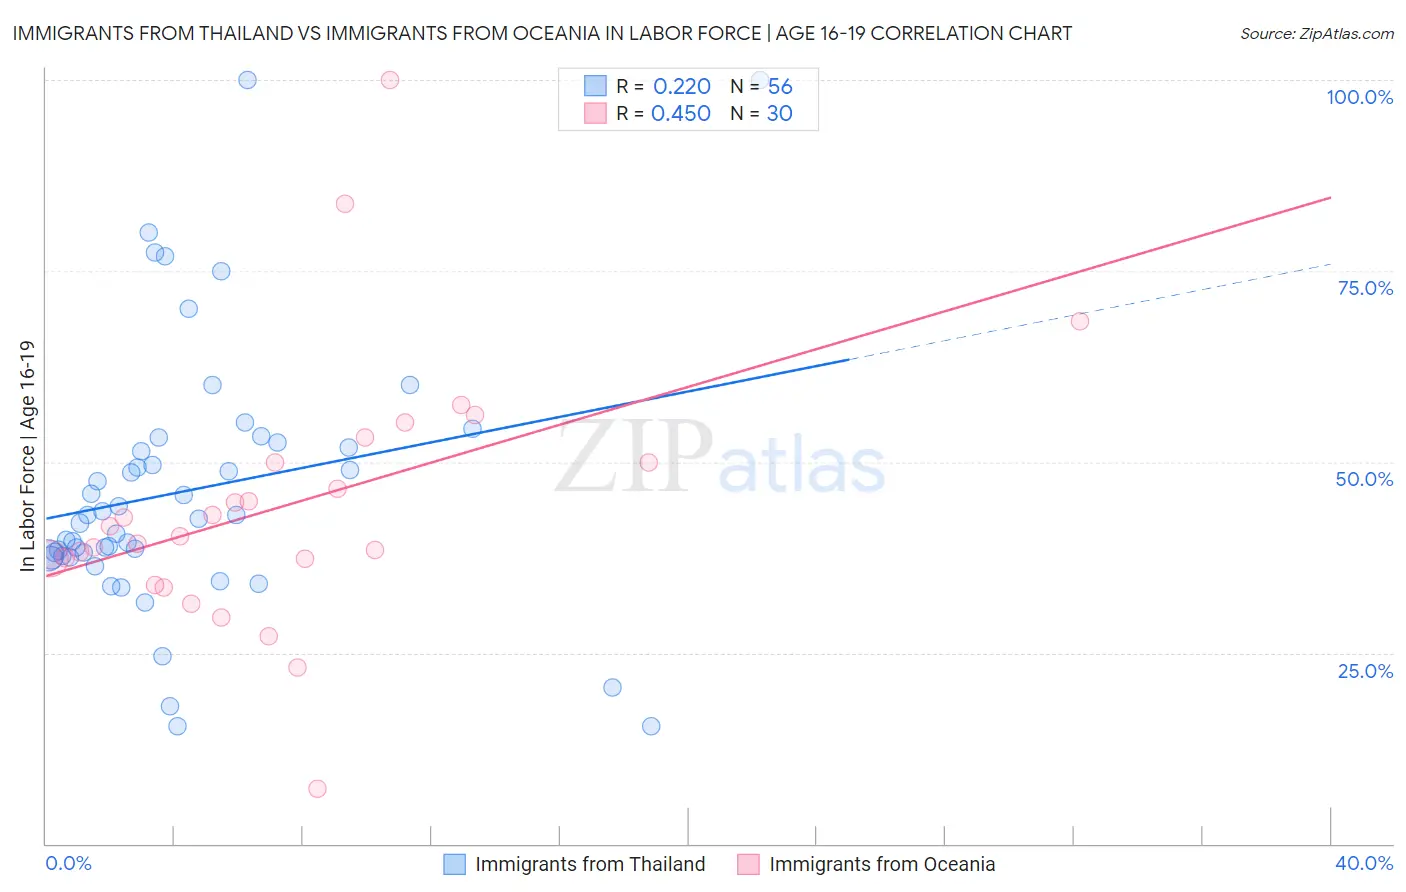
Immigrants from Thailand vs Immigrants from Oceania In Labor Force | Age 16-19 Correlation Chart
The statistical analysis conducted on geographies consisting of 316,722,585 people shows a weak positive correlation between the proportion of Immigrants from Thailand and labor force participation rate among population between the ages 16 and 19 in the United States with a correlation coefficient (R) of 0.220 and weighted average of 38.7%. Similarly, the statistical analysis conducted on geographies consisting of 305,018,730 people shows a moderate positive correlation between the proportion of Immigrants from Oceania and labor force participation rate among population between the ages 16 and 19 in the United States with a correlation coefficient (R) of 0.450 and weighted average of 37.9%, a difference of 2.2%.
In Labor Force | Age 16-19 Correlation Summary
| Measurement | Immigrants from Thailand | Immigrants from Oceania |
| Minimum | 15.4% | 7.3% |
| Maximum | 100.0% | 100.0% |
| Range | 84.6% | 92.7% |
| Mean | 46.3% | 44.3% |
| Median | 42.8% | 40.9% |
| Interquartile 25% (IQ1) | 37.7% | 37.3% |
| Interquartile 75% (IQ3) | 52.2% | 50.0% |
| Interquartile Range (IQR) | 14.5% | 12.7% |
| Standard Deviation (Sample) | 17.4% | 17.5% |
| Standard Deviation (Population) | 17.3% | 17.2% |
Similar Demographics by In Labor Force | Age 16-19
Demographics Similar to Immigrants from Thailand by In Labor Force | Age 16-19
In terms of in labor force | age 16-19, the demographic groups most similar to Immigrants from Thailand are Hmong (38.7%, a difference of 0.070%), Zimbabwean (38.7%, a difference of 0.070%), Immigrants from Cameroon (38.7%, a difference of 0.11%), Immigrants from Eritrea (38.7%, a difference of 0.16%), and Immigrants from North Macedonia (38.9%, a difference of 0.29%).
| Demographics | Rating | Rank | In Labor Force | Age 16-19 |
| Blackfeet | 99.4 /100 | #93 | Exceptional 38.9% |
| Immigrants | Canada | 99.4 /100 | #94 | Exceptional 38.9% |
| Immigrants | North America | 99.4 /100 | #95 | Exceptional 38.9% |
| Latvians | 99.4 /100 | #96 | Exceptional 38.9% |
| Greeks | 99.3 /100 | #97 | Exceptional 38.9% |
| Ugandans | 99.3 /100 | #98 | Exceptional 38.9% |
| Immigrants | North Macedonia | 99.3 /100 | #99 | Exceptional 38.9% |
| Immigrants | Thailand | 99.1 /100 | #100 | Exceptional 38.7% |
| Hmong | 99.1 /100 | #101 | Exceptional 38.7% |
| Zimbabweans | 99.1 /100 | #102 | Exceptional 38.7% |
| Immigrants | Cameroon | 99.0 /100 | #103 | Exceptional 38.7% |
| Immigrants | Eritrea | 99.0 /100 | #104 | Exceptional 38.7% |
| Iraqis | 98.9 /100 | #105 | Exceptional 38.6% |
| Delaware | 98.8 /100 | #106 | Exceptional 38.6% |
| Chinese | 98.8 /100 | #107 | Exceptional 38.6% |
Demographics Similar to Immigrants from Oceania by In Labor Force | Age 16-19
In terms of in labor force | age 16-19, the demographic groups most similar to Immigrants from Oceania are Cheyenne (37.9%, a difference of 0.020%), Immigrants from Austria (37.9%, a difference of 0.080%), Immigrants from Zimbabwe (38.0%, a difference of 0.18%), Spaniard (38.0%, a difference of 0.21%), and Choctaw (38.0%, a difference of 0.23%).
| Demographics | Rating | Rank | In Labor Force | Age 16-19 |
| Immigrants | Africa | 96.1 /100 | #125 | Exceptional 38.0% |
| Africans | 95.6 /100 | #126 | Exceptional 38.0% |
| Choctaw | 95.6 /100 | #127 | Exceptional 38.0% |
| New Zealanders | 95.6 /100 | #128 | Exceptional 38.0% |
| Spaniards | 95.5 /100 | #129 | Exceptional 38.0% |
| Immigrants | Zimbabwe | 95.4 /100 | #130 | Exceptional 38.0% |
| Immigrants | Austria | 95.0 /100 | #131 | Exceptional 37.9% |
| Immigrants | Oceania | 94.7 /100 | #132 | Exceptional 37.9% |
| Cheyenne | 94.6 /100 | #133 | Exceptional 37.9% |
| Immigrants | Netherlands | 93.7 /100 | #134 | Exceptional 37.8% |
| Macedonians | 93.4 /100 | #135 | Exceptional 37.8% |
| Australians | 93.2 /100 | #136 | Exceptional 37.8% |
| Cajuns | 93.2 /100 | #137 | Exceptional 37.8% |
| Comanche | 91.9 /100 | #138 | Exceptional 37.7% |
| Immigrants | Moldova | 91.9 /100 | #139 | Exceptional 37.7% |