Paraguayan vs French In Labor Force | Age 16-19
COMPARE
Paraguayan
French
In Labor Force | Age 16-19
In Labor Force | Age 16-19 Comparison
Paraguayans
French
33.8%
IN LABOR FORCE | AGE 16-19
0.3/ 100
METRIC RATING
279th/ 347
METRIC RANK
42.1%
IN LABOR FORCE | AGE 16-19
100.0/ 100
METRIC RATING
29th/ 347
METRIC RANK
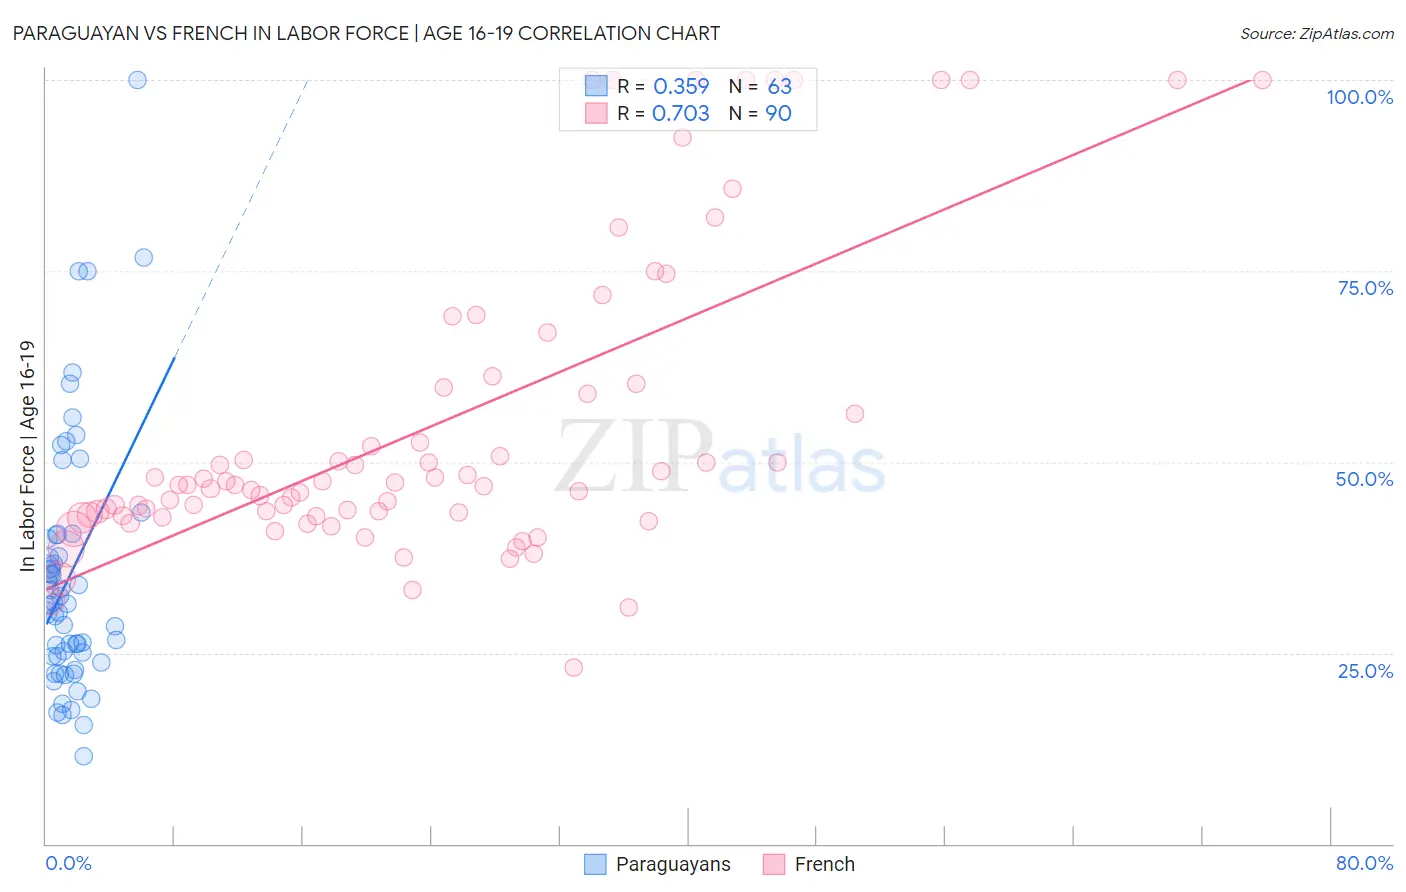
Paraguayan vs French In Labor Force | Age 16-19 Correlation Chart
The statistical analysis conducted on geographies consisting of 95,093,714 people shows a mild positive correlation between the proportion of Paraguayans and labor force participation rate among population between the ages 16 and 19 in the United States with a correlation coefficient (R) of 0.359 and weighted average of 33.8%. Similarly, the statistical analysis conducted on geographies consisting of 568,177,224 people shows a strong positive correlation between the proportion of French and labor force participation rate among population between the ages 16 and 19 in the United States with a correlation coefficient (R) of 0.703 and weighted average of 42.1%, a difference of 24.5%.
In Labor Force | Age 16-19 Correlation Summary
| Measurement | Paraguayan | French |
| Minimum | 11.4% | 23.1% |
| Maximum | 100.0% | 100.0% |
| Range | 88.6% | 76.9% |
| Mean | 35.2% | 54.6% |
| Median | 31.5% | 47.0% |
| Interquartile 25% (IQ1) | 24.5% | 43.0% |
| Interquartile 75% (IQ3) | 40.5% | 59.8% |
| Interquartile Range (IQR) | 16.0% | 16.9% |
| Standard Deviation (Sample) | 16.8% | 20.0% |
| Standard Deviation (Population) | 16.6% | 19.9% |
Similar Demographics by In Labor Force | Age 16-19
Demographics Similar to Paraguayans by In Labor Force | Age 16-19
In terms of in labor force | age 16-19, the demographic groups most similar to Paraguayans are Colombian (33.8%, a difference of 0.010%), Taiwanese (33.8%, a difference of 0.010%), Cypriot (33.8%, a difference of 0.010%), Immigrants from Korea (33.8%, a difference of 0.020%), and Menominee (33.9%, a difference of 0.080%).
| Demographics | Rating | Rank | In Labor Force | Age 16-19 |
| Asians | 0.4 /100 | #272 | Tragic 34.1% |
| Immigrants | Panama | 0.4 /100 | #273 | Tragic 34.0% |
| Venezuelans | 0.3 /100 | #274 | Tragic 34.0% |
| Immigrants | Fiji | 0.3 /100 | #275 | Tragic 33.9% |
| Immigrants | Latin America | 0.3 /100 | #276 | Tragic 33.9% |
| Menominee | 0.3 /100 | #277 | Tragic 33.9% |
| Colombians | 0.3 /100 | #278 | Tragic 33.8% |
| Paraguayans | 0.3 /100 | #279 | Tragic 33.8% |
| Taiwanese | 0.3 /100 | #280 | Tragic 33.8% |
| Cypriots | 0.3 /100 | #281 | Tragic 33.8% |
| Immigrants | Korea | 0.3 /100 | #282 | Tragic 33.8% |
| Immigrants | Venezuela | 0.2 /100 | #283 | Tragic 33.7% |
| Immigrants | Spain | 0.2 /100 | #284 | Tragic 33.7% |
| U.S. Virgin Islanders | 0.2 /100 | #285 | Tragic 33.6% |
| South Americans | 0.2 /100 | #286 | Tragic 33.6% |
Demographics Similar to French by In Labor Force | Age 16-19
In terms of in labor force | age 16-19, the demographic groups most similar to French are Polish (42.1%, a difference of 0.050%), Scottish (42.0%, a difference of 0.28%), Welsh (42.3%, a difference of 0.35%), Irish (42.0%, a difference of 0.35%), and Czechoslovakian (41.9%, a difference of 0.55%).
| Demographics | Rating | Rank | In Labor Force | Age 16-19 |
| Sudanese | 100.0 /100 | #22 | Exceptional 42.9% |
| Slovaks | 100.0 /100 | #23 | Exceptional 42.6% |
| Bangladeshis | 100.0 /100 | #24 | Exceptional 42.5% |
| German Russians | 100.0 /100 | #25 | Exceptional 42.4% |
| English | 100.0 /100 | #26 | Exceptional 42.4% |
| Welsh | 100.0 /100 | #27 | Exceptional 42.3% |
| Poles | 100.0 /100 | #28 | Exceptional 42.1% |
| French | 100.0 /100 | #29 | Exceptional 42.1% |
| Scottish | 100.0 /100 | #30 | Exceptional 42.0% |
| Irish | 100.0 /100 | #31 | Exceptional 42.0% |
| Czechoslovakians | 100.0 /100 | #32 | Exceptional 41.9% |
| Liberians | 100.0 /100 | #33 | Exceptional 41.8% |
| Immigrants | Bosnia and Herzegovina | 100.0 /100 | #34 | Exceptional 41.8% |
| Yugoslavians | 100.0 /100 | #35 | Exceptional 41.8% |
| Immigrants | Azores | 100.0 /100 | #36 | Exceptional 41.7% |