Paraguayan vs Indonesian In Labor Force | Age 16-19
COMPARE
Paraguayan
Indonesian
In Labor Force | Age 16-19
In Labor Force | Age 16-19 Comparison
Paraguayans
Indonesians
33.8%
IN LABOR FORCE | AGE 16-19
0.3/ 100
METRIC RATING
279th/ 347
METRIC RANK
40.7%
IN LABOR FORCE | AGE 16-19
100.0/ 100
METRIC RATING
50th/ 347
METRIC RANK
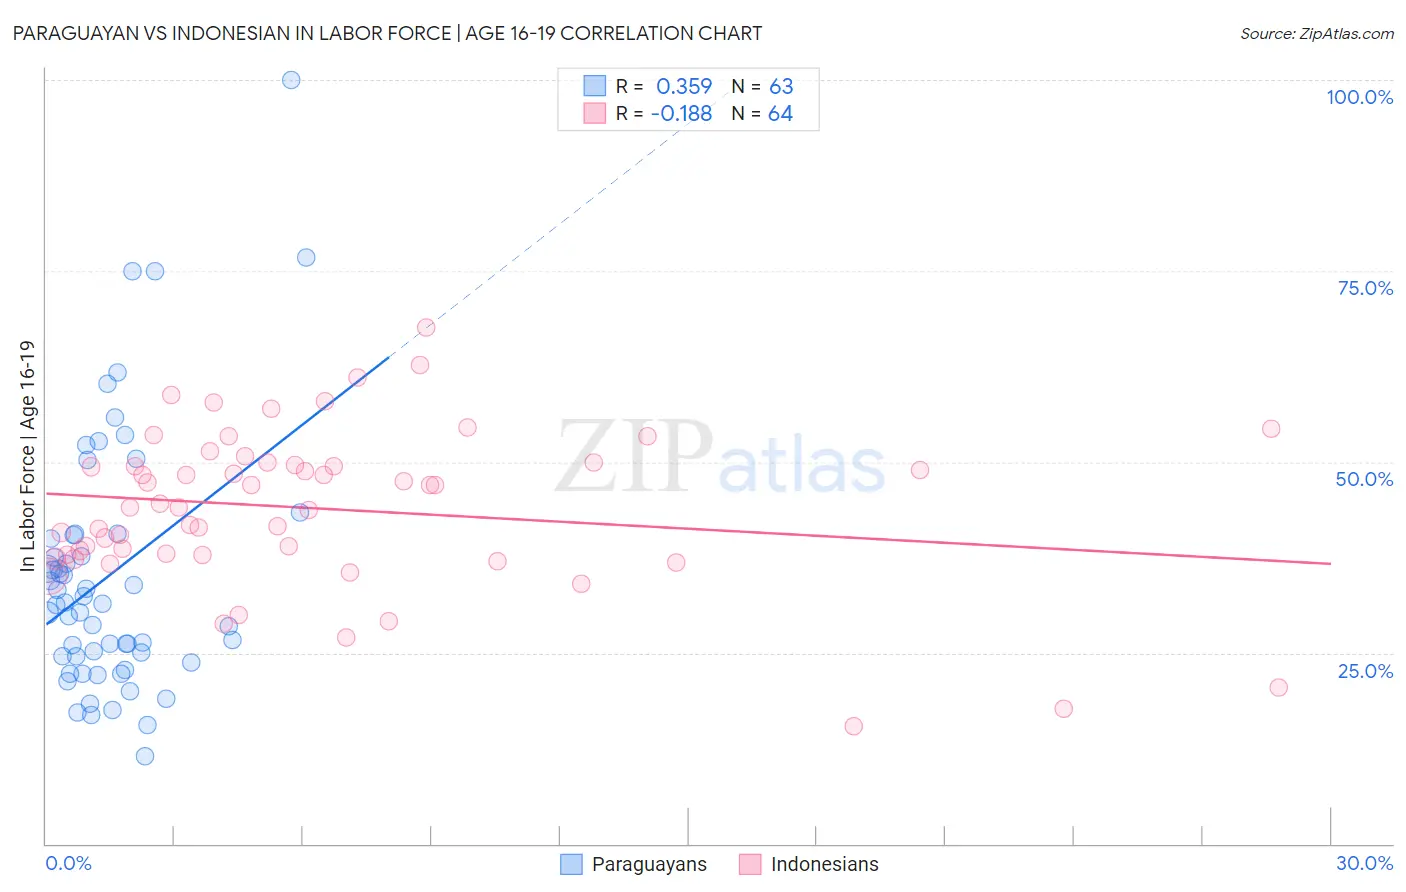
Paraguayan vs Indonesian In Labor Force | Age 16-19 Correlation Chart
The statistical analysis conducted on geographies consisting of 95,093,714 people shows a mild positive correlation between the proportion of Paraguayans and labor force participation rate among population between the ages 16 and 19 in the United States with a correlation coefficient (R) of 0.359 and weighted average of 33.8%. Similarly, the statistical analysis conducted on geographies consisting of 162,704,149 people shows a poor negative correlation between the proportion of Indonesians and labor force participation rate among population between the ages 16 and 19 in the United States with a correlation coefficient (R) of -0.188 and weighted average of 40.7%, a difference of 20.3%.
In Labor Force | Age 16-19 Correlation Summary
| Measurement | Paraguayan | Indonesian |
| Minimum | 11.4% | 15.4% |
| Maximum | 100.0% | 67.6% |
| Range | 88.6% | 52.2% |
| Mean | 35.2% | 43.9% |
| Median | 31.5% | 44.3% |
| Interquartile 25% (IQ1) | 24.5% | 37.8% |
| Interquartile 75% (IQ3) | 40.5% | 49.8% |
| Interquartile Range (IQR) | 16.0% | 11.9% |
| Standard Deviation (Sample) | 16.8% | 10.3% |
| Standard Deviation (Population) | 16.6% | 10.2% |
Similar Demographics by In Labor Force | Age 16-19
Demographics Similar to Paraguayans by In Labor Force | Age 16-19
In terms of in labor force | age 16-19, the demographic groups most similar to Paraguayans are Colombian (33.8%, a difference of 0.010%), Taiwanese (33.8%, a difference of 0.010%), Cypriot (33.8%, a difference of 0.010%), Immigrants from Korea (33.8%, a difference of 0.020%), and Menominee (33.9%, a difference of 0.080%).
| Demographics | Rating | Rank | In Labor Force | Age 16-19 |
| Asians | 0.4 /100 | #272 | Tragic 34.1% |
| Immigrants | Panama | 0.4 /100 | #273 | Tragic 34.0% |
| Venezuelans | 0.3 /100 | #274 | Tragic 34.0% |
| Immigrants | Fiji | 0.3 /100 | #275 | Tragic 33.9% |
| Immigrants | Latin America | 0.3 /100 | #276 | Tragic 33.9% |
| Menominee | 0.3 /100 | #277 | Tragic 33.9% |
| Colombians | 0.3 /100 | #278 | Tragic 33.8% |
| Paraguayans | 0.3 /100 | #279 | Tragic 33.8% |
| Taiwanese | 0.3 /100 | #280 | Tragic 33.8% |
| Cypriots | 0.3 /100 | #281 | Tragic 33.8% |
| Immigrants | Korea | 0.3 /100 | #282 | Tragic 33.8% |
| Immigrants | Venezuela | 0.2 /100 | #283 | Tragic 33.7% |
| Immigrants | Spain | 0.2 /100 | #284 | Tragic 33.7% |
| U.S. Virgin Islanders | 0.2 /100 | #285 | Tragic 33.6% |
| South Americans | 0.2 /100 | #286 | Tragic 33.6% |
Demographics Similar to Indonesians by In Labor Force | Age 16-19
In terms of in labor force | age 16-19, the demographic groups most similar to Indonesians are Immigrants from Zaire (40.7%, a difference of 0.10%), Cree (40.8%, a difference of 0.16%), Icelander (40.8%, a difference of 0.18%), Immigrants from Laos (40.6%, a difference of 0.19%), and Carpatho Rusyn (40.8%, a difference of 0.23%).
| Demographics | Rating | Rank | In Labor Force | Age 16-19 |
| Tongans | 100.0 /100 | #43 | Exceptional 41.2% |
| Europeans | 100.0 /100 | #44 | Exceptional 41.1% |
| Croatians | 100.0 /100 | #45 | Exceptional 41.1% |
| Immigrants | Sudan | 100.0 /100 | #46 | Exceptional 41.0% |
| Carpatho Rusyns | 100.0 /100 | #47 | Exceptional 40.8% |
| Icelanders | 100.0 /100 | #48 | Exceptional 40.8% |
| Cree | 100.0 /100 | #49 | Exceptional 40.8% |
| Indonesians | 100.0 /100 | #50 | Exceptional 40.7% |
| Immigrants | Zaire | 100.0 /100 | #51 | Exceptional 40.7% |
| Immigrants | Laos | 100.0 /100 | #52 | Exceptional 40.6% |
| Immigrants | Kenya | 100.0 /100 | #53 | Exceptional 40.5% |
| Tlingit-Haida | 100.0 /100 | #54 | Exceptional 40.5% |
| British | 100.0 /100 | #55 | Exceptional 40.5% |
| Fijians | 100.0 /100 | #56 | Exceptional 40.4% |
| Lithuanians | 100.0 /100 | #57 | Exceptional 40.4% |