Paraguayan vs Immigrants from Norway In Labor Force | Age 16-19
COMPARE
Paraguayan
Immigrants from Norway
In Labor Force | Age 16-19
In Labor Force | Age 16-19 Comparison
Paraguayans
Immigrants from Norway
33.8%
IN LABOR FORCE | AGE 16-19
0.3/ 100
METRIC RATING
279th/ 347
METRIC RANK
35.9%
IN LABOR FORCE | AGE 16-19
19.8/ 100
METRIC RATING
199th/ 347
METRIC RANK
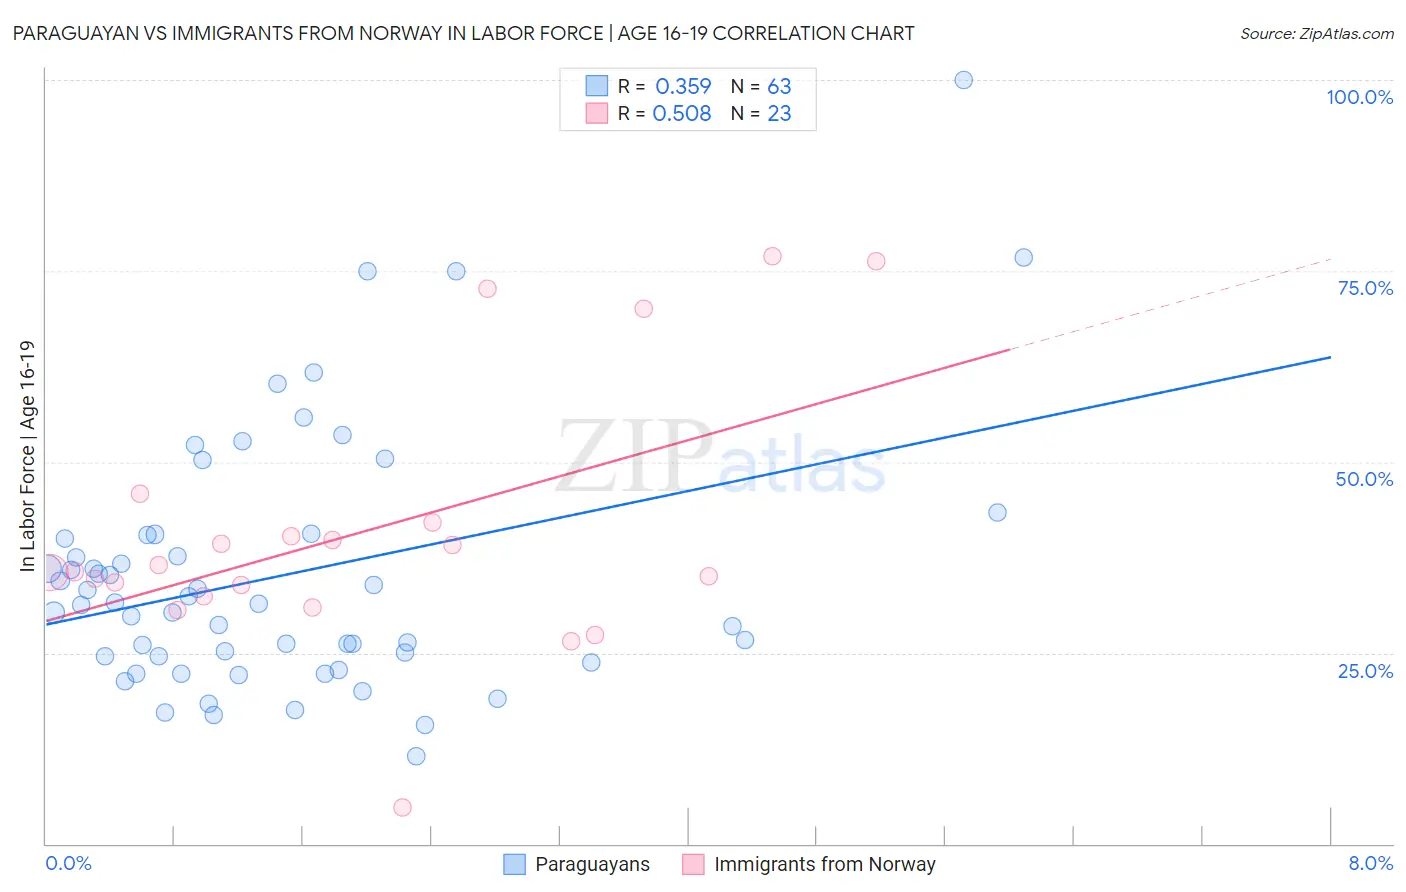
Paraguayan vs Immigrants from Norway In Labor Force | Age 16-19 Correlation Chart
The statistical analysis conducted on geographies consisting of 95,093,714 people shows a mild positive correlation between the proportion of Paraguayans and labor force participation rate among population between the ages 16 and 19 in the United States with a correlation coefficient (R) of 0.359 and weighted average of 33.8%. Similarly, the statistical analysis conducted on geographies consisting of 116,617,950 people shows a substantial positive correlation between the proportion of Immigrants from Norway and labor force participation rate among population between the ages 16 and 19 in the United States with a correlation coefficient (R) of 0.508 and weighted average of 35.9%, a difference of 6.2%.
In Labor Force | Age 16-19 Correlation Summary
| Measurement | Paraguayan | Immigrants from Norway |
| Minimum | 11.4% | 4.7% |
| Maximum | 100.0% | 76.9% |
| Range | 88.6% | 72.2% |
| Mean | 35.2% | 40.9% |
| Median | 31.5% | 35.6% |
| Interquartile 25% (IQ1) | 24.5% | 32.4% |
| Interquartile 75% (IQ3) | 40.5% | 42.0% |
| Interquartile Range (IQR) | 16.0% | 9.6% |
| Standard Deviation (Sample) | 16.8% | 17.4% |
| Standard Deviation (Population) | 16.6% | 17.0% |
Similar Demographics by In Labor Force | Age 16-19
Demographics Similar to Paraguayans by In Labor Force | Age 16-19
In terms of in labor force | age 16-19, the demographic groups most similar to Paraguayans are Colombian (33.8%, a difference of 0.010%), Taiwanese (33.8%, a difference of 0.010%), Cypriot (33.8%, a difference of 0.010%), Immigrants from Korea (33.8%, a difference of 0.020%), and Menominee (33.9%, a difference of 0.080%).
| Demographics | Rating | Rank | In Labor Force | Age 16-19 |
| Asians | 0.4 /100 | #272 | Tragic 34.1% |
| Immigrants | Panama | 0.4 /100 | #273 | Tragic 34.0% |
| Venezuelans | 0.3 /100 | #274 | Tragic 34.0% |
| Immigrants | Fiji | 0.3 /100 | #275 | Tragic 33.9% |
| Immigrants | Latin America | 0.3 /100 | #276 | Tragic 33.9% |
| Menominee | 0.3 /100 | #277 | Tragic 33.9% |
| Colombians | 0.3 /100 | #278 | Tragic 33.8% |
| Paraguayans | 0.3 /100 | #279 | Tragic 33.8% |
| Taiwanese | 0.3 /100 | #280 | Tragic 33.8% |
| Cypriots | 0.3 /100 | #281 | Tragic 33.8% |
| Immigrants | Korea | 0.3 /100 | #282 | Tragic 33.8% |
| Immigrants | Venezuela | 0.2 /100 | #283 | Tragic 33.7% |
| Immigrants | Spain | 0.2 /100 | #284 | Tragic 33.7% |
| U.S. Virgin Islanders | 0.2 /100 | #285 | Tragic 33.6% |
| South Americans | 0.2 /100 | #286 | Tragic 33.6% |
Demographics Similar to Immigrants from Norway by In Labor Force | Age 16-19
In terms of in labor force | age 16-19, the demographic groups most similar to Immigrants from Norway are Immigrants from Northern Africa (35.9%, a difference of 0.010%), Immigrants from Sweden (35.9%, a difference of 0.080%), Immigrants from Serbia (36.0%, a difference of 0.090%), Mexican American Indian (36.0%, a difference of 0.10%), and Alsatian (35.9%, a difference of 0.19%).
| Demographics | Rating | Rank | In Labor Force | Age 16-19 |
| Afghans | 25.7 /100 | #192 | Fair 36.1% |
| Immigrants | Denmark | 25.0 /100 | #193 | Fair 36.1% |
| Nigerians | 24.6 /100 | #194 | Fair 36.1% |
| Bolivians | 23.3 /100 | #195 | Fair 36.0% |
| Mexican American Indians | 21.1 /100 | #196 | Fair 36.0% |
| Immigrants | Serbia | 21.0 /100 | #197 | Fair 36.0% |
| Immigrants | Northern Africa | 19.9 /100 | #198 | Poor 35.9% |
| Immigrants | Norway | 19.8 /100 | #199 | Poor 35.9% |
| Immigrants | Sweden | 18.8 /100 | #200 | Poor 35.9% |
| Alsatians | 17.5 /100 | #201 | Poor 35.9% |
| Senegalese | 17.4 /100 | #202 | Poor 35.9% |
| Immigrants | Nigeria | 16.8 /100 | #203 | Poor 35.8% |
| Immigrants | Albania | 15.0 /100 | #204 | Poor 35.8% |
| South American Indians | 14.6 /100 | #205 | Poor 35.8% |
| Chileans | 14.6 /100 | #206 | Poor 35.8% |