Creek vs Immigrants from Oceania In Labor Force | Age 16-19
COMPARE
Creek
Immigrants from Oceania
In Labor Force | Age 16-19
In Labor Force | Age 16-19 Comparison
Creek
Immigrants from Oceania
39.1%
IN LABOR FORCE | AGE 16-19
99.6/ 100
METRIC RATING
85th/ 347
METRIC RANK
37.9%
IN LABOR FORCE | AGE 16-19
94.7/ 100
METRIC RATING
132nd/ 347
METRIC RANK
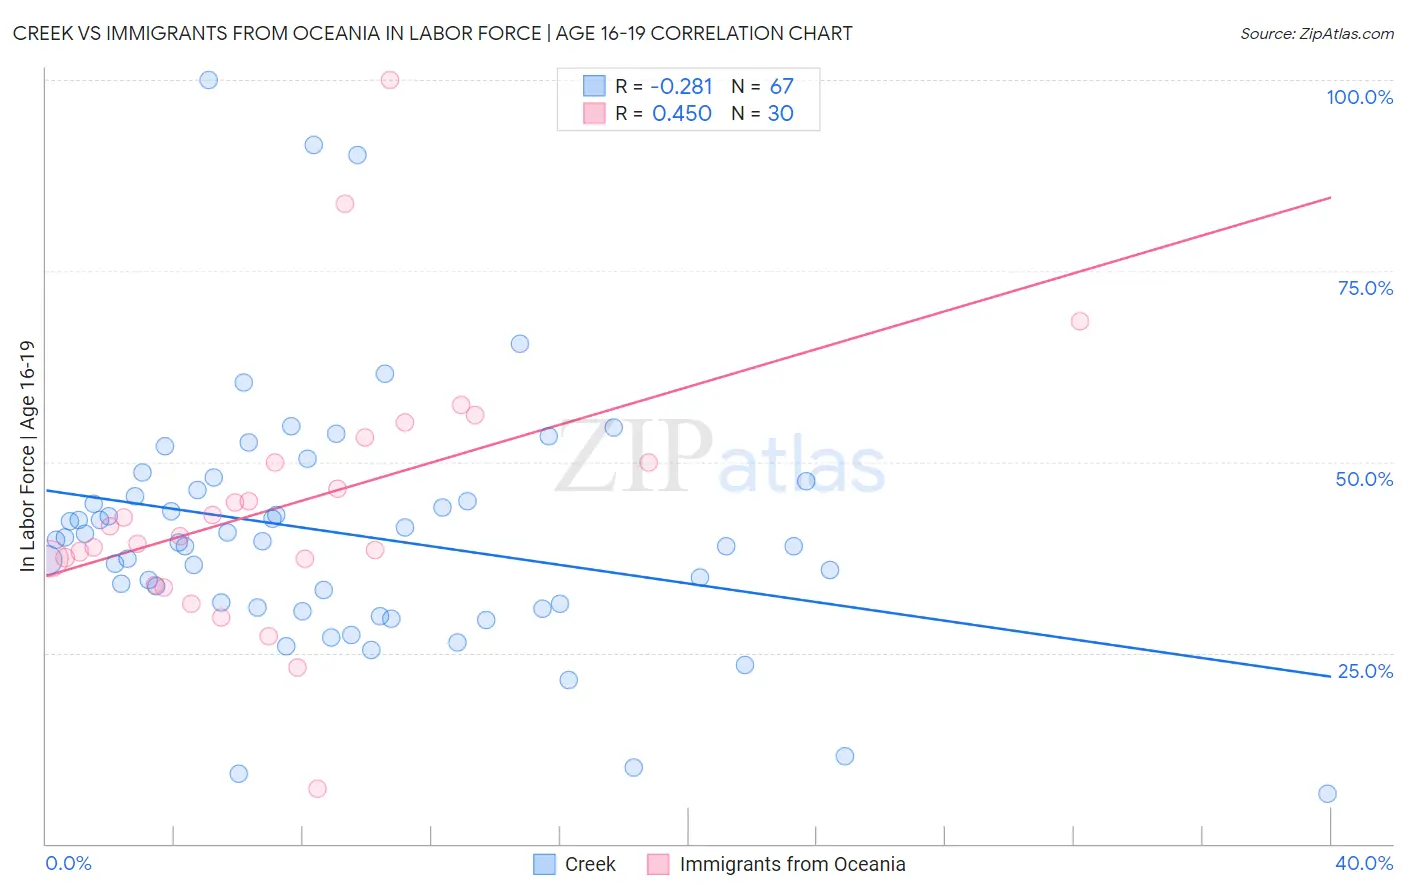
Creek vs Immigrants from Oceania In Labor Force | Age 16-19 Correlation Chart
The statistical analysis conducted on geographies consisting of 178,315,615 people shows a weak negative correlation between the proportion of Creek and labor force participation rate among population between the ages 16 and 19 in the United States with a correlation coefficient (R) of -0.281 and weighted average of 39.1%. Similarly, the statistical analysis conducted on geographies consisting of 305,018,730 people shows a moderate positive correlation between the proportion of Immigrants from Oceania and labor force participation rate among population between the ages 16 and 19 in the United States with a correlation coefficient (R) of 0.450 and weighted average of 37.9%, a difference of 3.3%.
In Labor Force | Age 16-19 Correlation Summary
| Measurement | Creek | Immigrants from Oceania |
| Minimum | 6.5% | 7.3% |
| Maximum | 100.0% | 100.0% |
| Range | 93.5% | 92.7% |
| Mean | 40.6% | 44.3% |
| Median | 39.7% | 40.9% |
| Interquartile 25% (IQ1) | 30.9% | 37.3% |
| Interquartile 75% (IQ3) | 46.2% | 50.0% |
| Interquartile Range (IQR) | 15.3% | 12.7% |
| Standard Deviation (Sample) | 16.6% | 17.5% |
| Standard Deviation (Population) | 16.5% | 17.2% |
Similar Demographics by In Labor Force | Age 16-19
Demographics Similar to Creek by In Labor Force | Age 16-19
In terms of in labor force | age 16-19, the demographic groups most similar to Creek are Samoan (39.1%, a difference of 0.020%), Immigrants from Germany (39.1%, a difference of 0.10%), Immigrants from Uganda (39.2%, a difference of 0.15%), Puget Sound Salish (39.1%, a difference of 0.17%), and Alaska Native (39.1%, a difference of 0.18%).
| Demographics | Rating | Rank | In Labor Force | Age 16-19 |
| Austrians | 99.8 /100 | #78 | Exceptional 39.5% |
| Marshallese | 99.8 /100 | #79 | Exceptional 39.5% |
| Immigrants | Iraq | 99.8 /100 | #80 | Exceptional 39.4% |
| Shoshone | 99.7 /100 | #81 | Exceptional 39.3% |
| Basques | 99.7 /100 | #82 | Exceptional 39.3% |
| Spanish | 99.7 /100 | #83 | Exceptional 39.3% |
| Immigrants | Uganda | 99.7 /100 | #84 | Exceptional 39.2% |
| Creek | 99.6 /100 | #85 | Exceptional 39.1% |
| Samoans | 99.6 /100 | #86 | Exceptional 39.1% |
| Immigrants | Germany | 99.6 /100 | #87 | Exceptional 39.1% |
| Puget Sound Salish | 99.6 /100 | #88 | Exceptional 39.1% |
| Alaska Natives | 99.6 /100 | #89 | Exceptional 39.1% |
| Immigrants | Burma/Myanmar | 99.5 /100 | #90 | Exceptional 39.0% |
| Spanish Americans | 99.5 /100 | #91 | Exceptional 39.0% |
| Osage | 99.4 /100 | #92 | Exceptional 39.0% |
Demographics Similar to Immigrants from Oceania by In Labor Force | Age 16-19
In terms of in labor force | age 16-19, the demographic groups most similar to Immigrants from Oceania are Cheyenne (37.9%, a difference of 0.020%), Immigrants from Austria (37.9%, a difference of 0.080%), Immigrants from Zimbabwe (38.0%, a difference of 0.18%), Spaniard (38.0%, a difference of 0.21%), and Choctaw (38.0%, a difference of 0.23%).
| Demographics | Rating | Rank | In Labor Force | Age 16-19 |
| Immigrants | Africa | 96.1 /100 | #125 | Exceptional 38.0% |
| Africans | 95.6 /100 | #126 | Exceptional 38.0% |
| Choctaw | 95.6 /100 | #127 | Exceptional 38.0% |
| New Zealanders | 95.6 /100 | #128 | Exceptional 38.0% |
| Spaniards | 95.5 /100 | #129 | Exceptional 38.0% |
| Immigrants | Zimbabwe | 95.4 /100 | #130 | Exceptional 38.0% |
| Immigrants | Austria | 95.0 /100 | #131 | Exceptional 37.9% |
| Immigrants | Oceania | 94.7 /100 | #132 | Exceptional 37.9% |
| Cheyenne | 94.6 /100 | #133 | Exceptional 37.9% |
| Immigrants | Netherlands | 93.7 /100 | #134 | Exceptional 37.8% |
| Macedonians | 93.4 /100 | #135 | Exceptional 37.8% |
| Australians | 93.2 /100 | #136 | Exceptional 37.8% |
| Cajuns | 93.2 /100 | #137 | Exceptional 37.8% |
| Comanche | 91.9 /100 | #138 | Exceptional 37.7% |
| Immigrants | Moldova | 91.9 /100 | #139 | Exceptional 37.7% |