Palestinian vs Immigrants from Taiwan In Labor Force | Age 16-19
COMPARE
Palestinian
Immigrants from Taiwan
In Labor Force | Age 16-19
In Labor Force | Age 16-19 Comparison
Palestinians
Immigrants from Taiwan
36.8%
IN LABOR FORCE | AGE 16-19
63.1/ 100
METRIC RATING
168th/ 347
METRIC RANK
31.0%
IN LABOR FORCE | AGE 16-19
0.0/ 100
METRIC RATING
327th/ 347
METRIC RANK
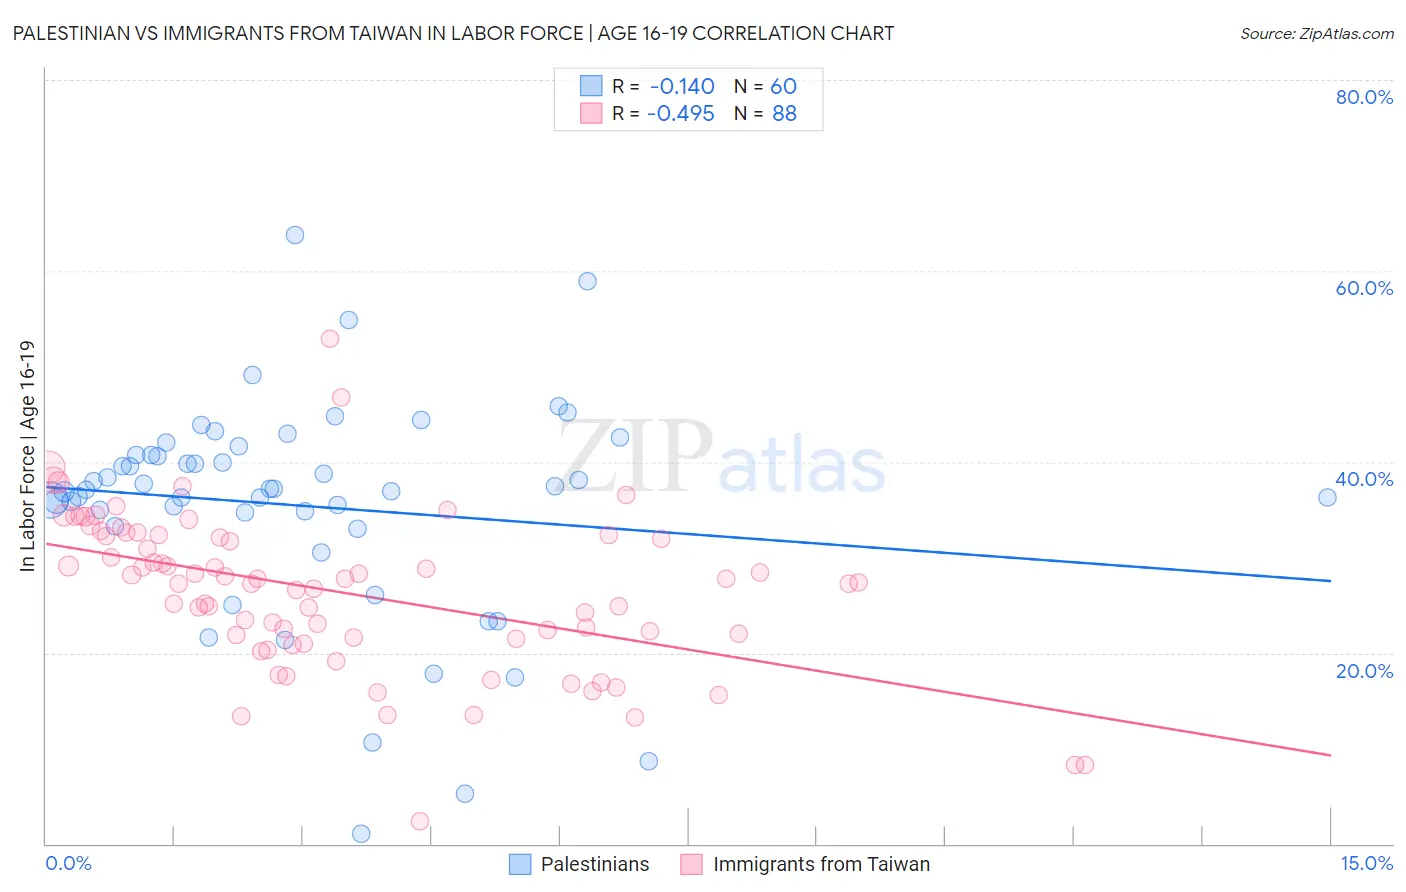
Palestinian vs Immigrants from Taiwan In Labor Force | Age 16-19 Correlation Chart
The statistical analysis conducted on geographies consisting of 216,397,857 people shows a poor negative correlation between the proportion of Palestinians and labor force participation rate among population between the ages 16 and 19 in the United States with a correlation coefficient (R) of -0.140 and weighted average of 36.8%. Similarly, the statistical analysis conducted on geographies consisting of 297,913,482 people shows a moderate negative correlation between the proportion of Immigrants from Taiwan and labor force participation rate among population between the ages 16 and 19 in the United States with a correlation coefficient (R) of -0.495 and weighted average of 31.0%, a difference of 18.6%.
In Labor Force | Age 16-19 Correlation Summary
| Measurement | Palestinian | Immigrants from Taiwan |
| Minimum | 1.1% | 2.3% |
| Maximum | 63.8% | 52.9% |
| Range | 62.7% | 50.6% |
| Mean | 35.4% | 26.3% |
| Median | 37.1% | 27.3% |
| Interquartile 25% (IQ1) | 34.0% | 21.5% |
| Interquartile 75% (IQ3) | 40.7% | 32.3% |
| Interquartile Range (IQR) | 6.8% | 10.7% |
| Standard Deviation (Sample) | 11.5% | 8.3% |
| Standard Deviation (Population) | 11.4% | 8.2% |
Similar Demographics by In Labor Force | Age 16-19
Demographics Similar to Palestinians by In Labor Force | Age 16-19
In terms of in labor force | age 16-19, the demographic groups most similar to Palestinians are Arab (36.8%, a difference of 0.030%), Immigrants from Latvia (36.8%, a difference of 0.080%), Immigrants from South Africa (36.8%, a difference of 0.14%), Immigrants from Western Africa (36.9%, a difference of 0.20%), and Yakama (36.9%, a difference of 0.21%).
| Demographics | Rating | Rank | In Labor Force | Age 16-19 |
| Cambodians | 71.5 /100 | #161 | Good 37.0% |
| Immigrants | Jordan | 69.5 /100 | #162 | Good 36.9% |
| Bermudans | 69.3 /100 | #163 | Good 36.9% |
| Immigrants | Kuwait | 68.9 /100 | #164 | Good 36.9% |
| Yakama | 66.9 /100 | #165 | Good 36.9% |
| Immigrants | Western Africa | 66.7 /100 | #166 | Good 36.9% |
| Arabs | 63.6 /100 | #167 | Good 36.8% |
| Palestinians | 63.1 /100 | #168 | Good 36.8% |
| Immigrants | Latvia | 61.6 /100 | #169 | Good 36.8% |
| Immigrants | South Africa | 60.5 /100 | #170 | Good 36.8% |
| Immigrants | Cambodia | 58.4 /100 | #171 | Average 36.7% |
| South Africans | 58.3 /100 | #172 | Average 36.7% |
| Russians | 57.5 /100 | #173 | Average 36.7% |
| Immigrants | Czechoslovakia | 50.0 /100 | #174 | Average 36.6% |
| Natives/Alaskans | 49.0 /100 | #175 | Average 36.6% |
Demographics Similar to Immigrants from Taiwan by In Labor Force | Age 16-19
In terms of in labor force | age 16-19, the demographic groups most similar to Immigrants from Taiwan are Immigrants from Ecuador (31.0%, a difference of 0.040%), Barbadian (31.0%, a difference of 0.070%), Immigrants from Dominican Republic (31.1%, a difference of 0.16%), Lumbee (31.0%, a difference of 0.19%), and Trinidadian and Tobagonian (30.9%, a difference of 0.34%).
| Demographics | Rating | Rank | In Labor Force | Age 16-19 |
| Ecuadorians | 0.0 /100 | #320 | Tragic 31.4% |
| West Indians | 0.0 /100 | #321 | Tragic 31.3% |
| Tohono O'odham | 0.0 /100 | #322 | Tragic 31.3% |
| Immigrants | Caribbean | 0.0 /100 | #323 | Tragic 31.2% |
| Dominicans | 0.0 /100 | #324 | Tragic 31.2% |
| Immigrants | China | 0.0 /100 | #325 | Tragic 31.1% |
| Immigrants | Dominican Republic | 0.0 /100 | #326 | Tragic 31.1% |
| Immigrants | Taiwan | 0.0 /100 | #327 | Tragic 31.0% |
| Immigrants | Ecuador | 0.0 /100 | #328 | Tragic 31.0% |
| Barbadians | 0.0 /100 | #329 | Tragic 31.0% |
| Lumbee | 0.0 /100 | #330 | Tragic 31.0% |
| Trinidadians and Tobagonians | 0.0 /100 | #331 | Tragic 30.9% |
| Immigrants | Israel | 0.0 /100 | #332 | Tragic 30.5% |
| Immigrants | Hong Kong | 0.0 /100 | #333 | Tragic 30.5% |
| Puerto Ricans | 0.0 /100 | #334 | Tragic 30.3% |