Canadian vs Immigrants from Taiwan In Labor Force | Age 16-19
COMPARE
Canadian
Immigrants from Taiwan
In Labor Force | Age 16-19
In Labor Force | Age 16-19 Comparison
Canadians
Immigrants from Taiwan
40.1%
IN LABOR FORCE | AGE 16-19
100.0/ 100
METRIC RATING
67th/ 347
METRIC RANK
31.0%
IN LABOR FORCE | AGE 16-19
0.0/ 100
METRIC RATING
327th/ 347
METRIC RANK
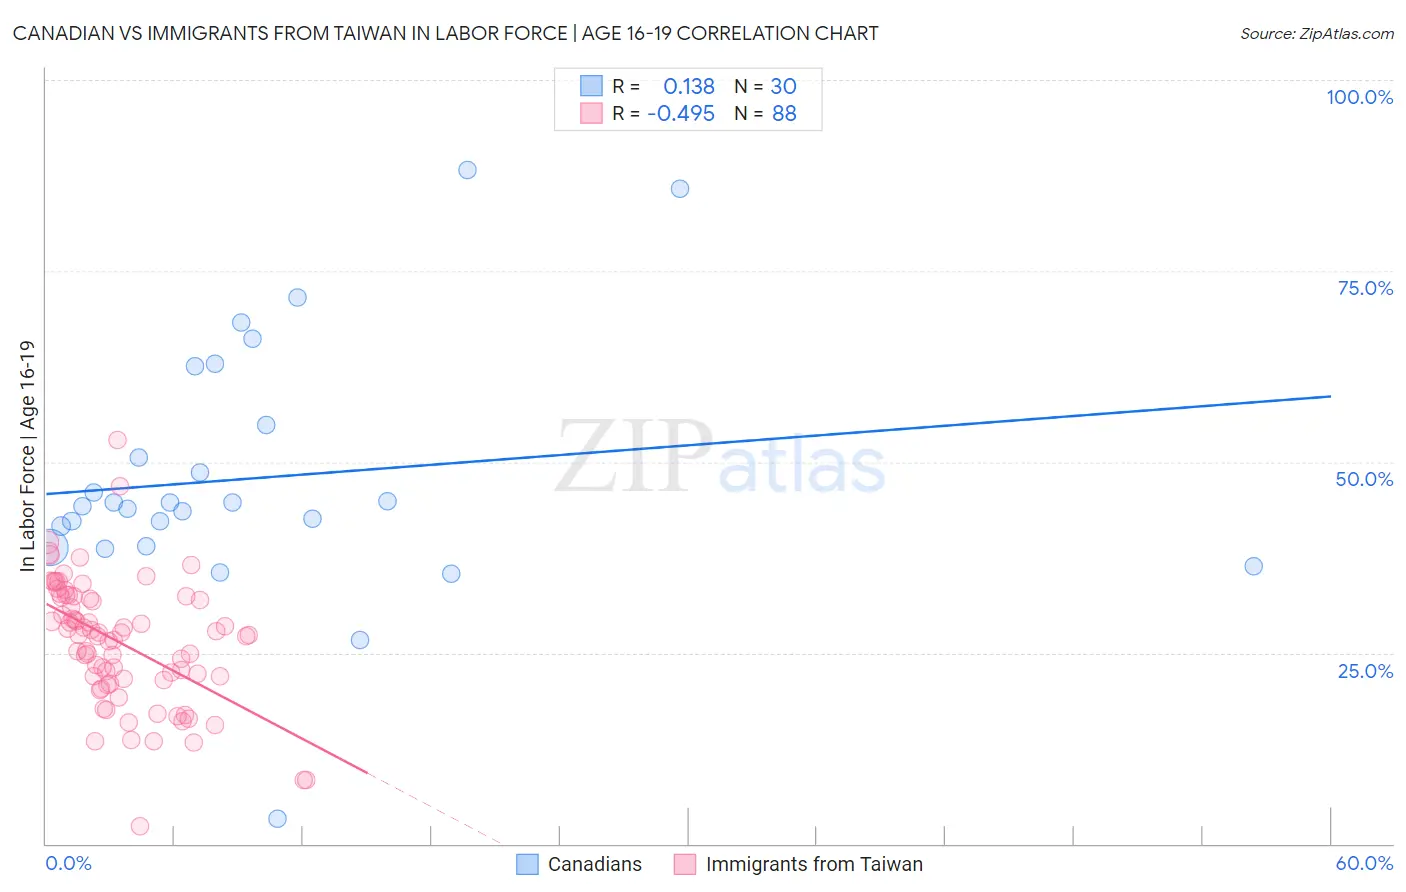
Canadian vs Immigrants from Taiwan In Labor Force | Age 16-19 Correlation Chart
The statistical analysis conducted on geographies consisting of 436,563,556 people shows a poor positive correlation between the proportion of Canadians and labor force participation rate among population between the ages 16 and 19 in the United States with a correlation coefficient (R) of 0.138 and weighted average of 40.1%. Similarly, the statistical analysis conducted on geographies consisting of 297,913,482 people shows a moderate negative correlation between the proportion of Immigrants from Taiwan and labor force participation rate among population between the ages 16 and 19 in the United States with a correlation coefficient (R) of -0.495 and weighted average of 31.0%, a difference of 29.2%.
In Labor Force | Age 16-19 Correlation Summary
| Measurement | Canadian | Immigrants from Taiwan |
| Minimum | 3.2% | 2.3% |
| Maximum | 88.2% | 52.9% |
| Range | 85.0% | 50.6% |
| Mean | 47.9% | 26.3% |
| Median | 44.4% | 27.3% |
| Interquartile 25% (IQ1) | 39.0% | 21.5% |
| Interquartile 75% (IQ3) | 54.8% | 32.3% |
| Interquartile Range (IQR) | 15.8% | 10.7% |
| Standard Deviation (Sample) | 16.8% | 8.3% |
| Standard Deviation (Population) | 16.6% | 8.2% |
Similar Demographics by In Labor Force | Age 16-19
Demographics Similar to Canadians by In Labor Force | Age 16-19
In terms of in labor force | age 16-19, the demographic groups most similar to Canadians are Nonimmigrants (40.1%, a difference of 0.010%), Italian (40.1%, a difference of 0.060%), Kenyan (40.1%, a difference of 0.13%), Potawatomi (40.0%, a difference of 0.13%), and Portuguese (40.0%, a difference of 0.18%).
| Demographics | Rating | Rank | In Labor Force | Age 16-19 |
| Immigrants | Eastern Africa | 100.0 /100 | #60 | Exceptional 40.4% |
| Americans | 100.0 /100 | #61 | Exceptional 40.3% |
| Cherokee | 100.0 /100 | #62 | Exceptional 40.2% |
| Northern Europeans | 100.0 /100 | #63 | Exceptional 40.2% |
| Immigrants | Micronesia | 100.0 /100 | #64 | Exceptional 40.2% |
| Kenyans | 100.0 /100 | #65 | Exceptional 40.1% |
| Immigrants | Nonimmigrants | 100.0 /100 | #66 | Exceptional 40.1% |
| Canadians | 100.0 /100 | #67 | Exceptional 40.1% |
| Italians | 99.9 /100 | #68 | Exceptional 40.1% |
| Potawatomi | 99.9 /100 | #69 | Exceptional 40.0% |
| Portuguese | 99.9 /100 | #70 | Exceptional 40.0% |
| Serbians | 99.9 /100 | #71 | Exceptional 39.9% |
| Iroquois | 99.9 /100 | #72 | Exceptional 39.9% |
| Immigrants | Middle Africa | 99.9 /100 | #73 | Exceptional 39.9% |
| Hungarians | 99.9 /100 | #74 | Exceptional 39.8% |
Demographics Similar to Immigrants from Taiwan by In Labor Force | Age 16-19
In terms of in labor force | age 16-19, the demographic groups most similar to Immigrants from Taiwan are Immigrants from Ecuador (31.0%, a difference of 0.040%), Barbadian (31.0%, a difference of 0.070%), Immigrants from Dominican Republic (31.1%, a difference of 0.16%), Lumbee (31.0%, a difference of 0.19%), and Trinidadian and Tobagonian (30.9%, a difference of 0.34%).
| Demographics | Rating | Rank | In Labor Force | Age 16-19 |
| Ecuadorians | 0.0 /100 | #320 | Tragic 31.4% |
| West Indians | 0.0 /100 | #321 | Tragic 31.3% |
| Tohono O'odham | 0.0 /100 | #322 | Tragic 31.3% |
| Immigrants | Caribbean | 0.0 /100 | #323 | Tragic 31.2% |
| Dominicans | 0.0 /100 | #324 | Tragic 31.2% |
| Immigrants | China | 0.0 /100 | #325 | Tragic 31.1% |
| Immigrants | Dominican Republic | 0.0 /100 | #326 | Tragic 31.1% |
| Immigrants | Taiwan | 0.0 /100 | #327 | Tragic 31.0% |
| Immigrants | Ecuador | 0.0 /100 | #328 | Tragic 31.0% |
| Barbadians | 0.0 /100 | #329 | Tragic 31.0% |
| Lumbee | 0.0 /100 | #330 | Tragic 31.0% |
| Trinidadians and Tobagonians | 0.0 /100 | #331 | Tragic 30.9% |
| Immigrants | Israel | 0.0 /100 | #332 | Tragic 30.5% |
| Immigrants | Hong Kong | 0.0 /100 | #333 | Tragic 30.5% |
| Puerto Ricans | 0.0 /100 | #334 | Tragic 30.3% |