Palestinian vs Immigrants from Taiwan College, Under 1 year
COMPARE
Palestinian
Immigrants from Taiwan
College, Under 1 year
College, Under 1 year Comparison
Palestinians
Immigrants from Taiwan
67.9%
COLLEGE, UNDER 1 YEAR
96.9/ 100
METRIC RATING
102nd/ 347
METRIC RANK
74.2%
COLLEGE, UNDER 1 YEAR
100.0/ 100
METRIC RATING
6th/ 347
METRIC RANK
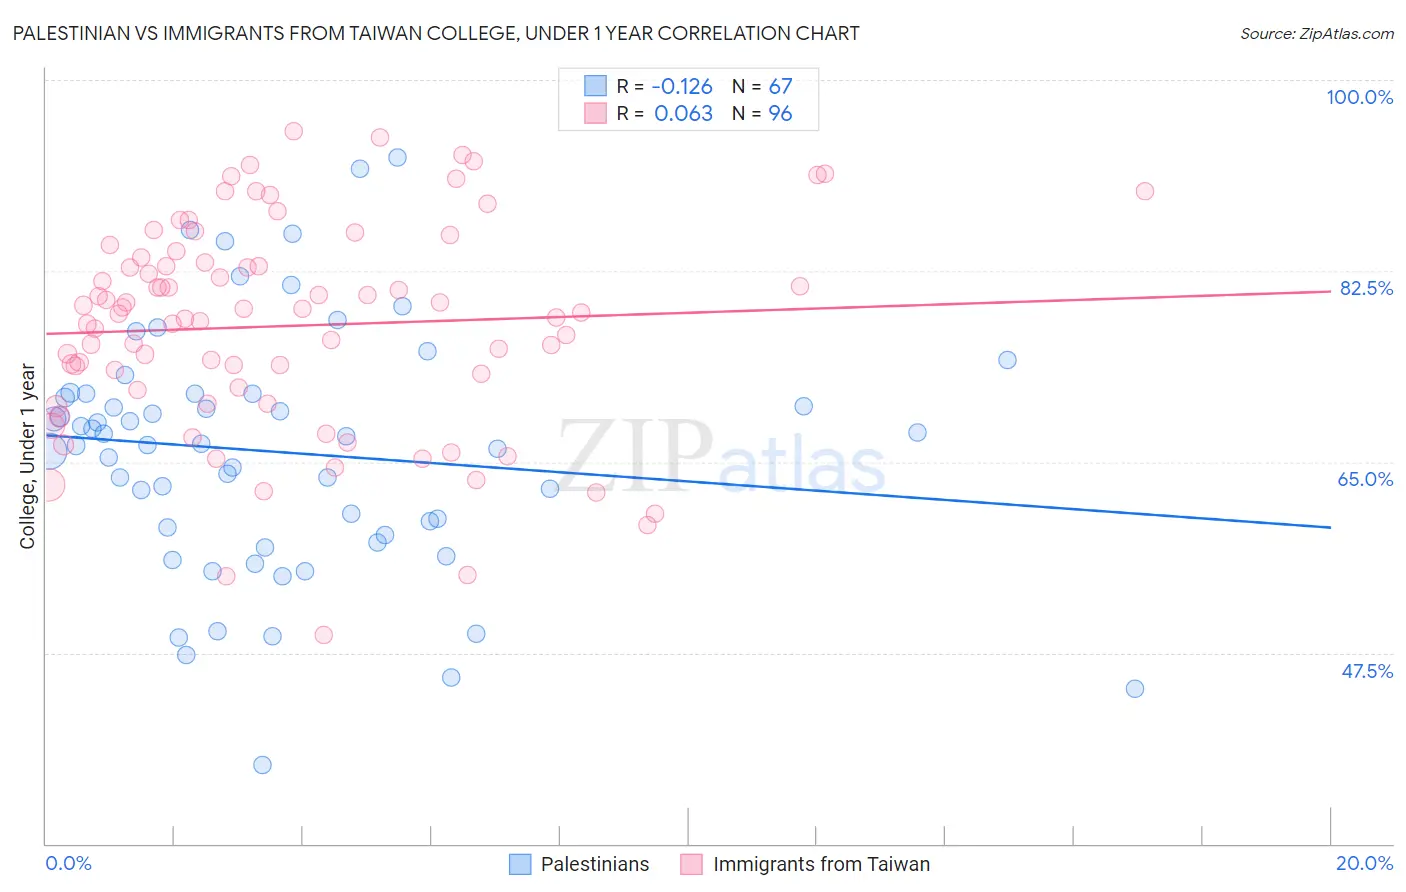
Palestinian vs Immigrants from Taiwan College, Under 1 year Correlation Chart
The statistical analysis conducted on geographies consisting of 216,461,770 people shows a poor negative correlation between the proportion of Palestinians and percentage of population with at least college, under 1 year education in the United States with a correlation coefficient (R) of -0.126 and weighted average of 67.9%. Similarly, the statistical analysis conducted on geographies consisting of 298,292,490 people shows a slight positive correlation between the proportion of Immigrants from Taiwan and percentage of population with at least college, under 1 year education in the United States with a correlation coefficient (R) of 0.063 and weighted average of 74.2%, a difference of 9.3%.
College, Under 1 year Correlation Summary
| Measurement | Palestinian | Immigrants from Taiwan |
| Minimum | 37.3% | 49.2% |
| Maximum | 92.9% | 95.3% |
| Range | 55.6% | 46.1% |
| Mean | 65.9% | 77.5% |
| Median | 66.6% | 78.6% |
| Interquartile 25% (IQ1) | 58.3% | 71.7% |
| Interquartile 75% (IQ3) | 71.2% | 83.5% |
| Interquartile Range (IQR) | 12.9% | 11.8% |
| Standard Deviation (Sample) | 11.3% | 9.7% |
| Standard Deviation (Population) | 11.2% | 9.6% |
Similar Demographics by College, Under 1 year
Demographics Similar to Palestinians by College, Under 1 year
In terms of college, under 1 year, the demographic groups most similar to Palestinians are Immigrants from Eastern Europe (67.9%, a difference of 0.0%), Carpatho Rusyn (67.9%, a difference of 0.010%), Immigrants from Argentina (67.9%, a difference of 0.050%), Immigrants from Bolivia (67.9%, a difference of 0.060%), and Paraguayan (67.9%, a difference of 0.080%).
| Demographics | Rating | Rank | College, Under 1 year |
| Immigrants | Pakistan | 97.5 /100 | #95 | Exceptional 68.0% |
| Jordanians | 97.4 /100 | #96 | Exceptional 68.0% |
| Immigrants | Ethiopia | 97.3 /100 | #97 | Exceptional 68.0% |
| Paraguayans | 97.1 /100 | #98 | Exceptional 67.9% |
| Immigrants | Bolivia | 97.0 /100 | #99 | Exceptional 67.9% |
| Immigrants | Argentina | 97.0 /100 | #100 | Exceptional 67.9% |
| Immigrants | Eastern Europe | 96.9 /100 | #101 | Exceptional 67.9% |
| Palestinians | 96.9 /100 | #102 | Exceptional 67.9% |
| Carpatho Rusyns | 96.8 /100 | #103 | Exceptional 67.9% |
| Immigrants | Western Asia | 96.6 /100 | #104 | Exceptional 67.8% |
| Afghans | 96.6 /100 | #105 | Exceptional 67.8% |
| Immigrants | Croatia | 96.6 /100 | #106 | Exceptional 67.8% |
| Austrians | 96.4 /100 | #107 | Exceptional 67.8% |
| Immigrants | Egypt | 96.0 /100 | #108 | Exceptional 67.7% |
| Scandinavians | 95.8 /100 | #109 | Exceptional 67.7% |
Demographics Similar to Immigrants from Taiwan by College, Under 1 year
In terms of college, under 1 year, the demographic groups most similar to Immigrants from Taiwan are Immigrants from Iran (74.3%, a difference of 0.11%), Immigrants from India (74.4%, a difference of 0.34%), Okinawan (73.7%, a difference of 0.70%), Immigrants from Singapore (74.8%, a difference of 0.85%), and Iranian (74.9%, a difference of 0.90%).
| Demographics | Rating | Rank | College, Under 1 year |
| Filipinos | 100.0 /100 | #1 | Exceptional 75.5% |
| Iranians | 100.0 /100 | #2 | Exceptional 74.9% |
| Immigrants | Singapore | 100.0 /100 | #3 | Exceptional 74.8% |
| Immigrants | India | 100.0 /100 | #4 | Exceptional 74.4% |
| Immigrants | Iran | 100.0 /100 | #5 | Exceptional 74.3% |
| Immigrants | Taiwan | 100.0 /100 | #6 | Exceptional 74.2% |
| Okinawans | 100.0 /100 | #7 | Exceptional 73.7% |
| Thais | 100.0 /100 | #8 | Exceptional 73.4% |
| Immigrants | Australia | 100.0 /100 | #9 | Exceptional 72.7% |
| Immigrants | Israel | 100.0 /100 | #10 | Exceptional 72.3% |
| Immigrants | South Central Asia | 100.0 /100 | #11 | Exceptional 72.1% |
| Immigrants | Sweden | 100.0 /100 | #12 | Exceptional 72.1% |
| Cypriots | 100.0 /100 | #13 | Exceptional 72.0% |
| Cambodians | 100.0 /100 | #14 | Exceptional 71.9% |
| Burmese | 100.0 /100 | #15 | Exceptional 71.9% |