Immigrants from Ireland vs Immigrants from Israel In Labor Force | Age 20-64
COMPARE
Immigrants from Ireland
Immigrants from Israel
In Labor Force | Age 20-64
In Labor Force | Age 20-64 Comparison
Immigrants from Ireland
Immigrants from Israel
80.7%
IN LABOR FORCE | AGE 20-64
99.9/ 100
METRIC RATING
32nd/ 347
METRIC RANK
79.8%
IN LABOR FORCE | AGE 20-64
80.0/ 100
METRIC RATING
141st/ 347
METRIC RANK
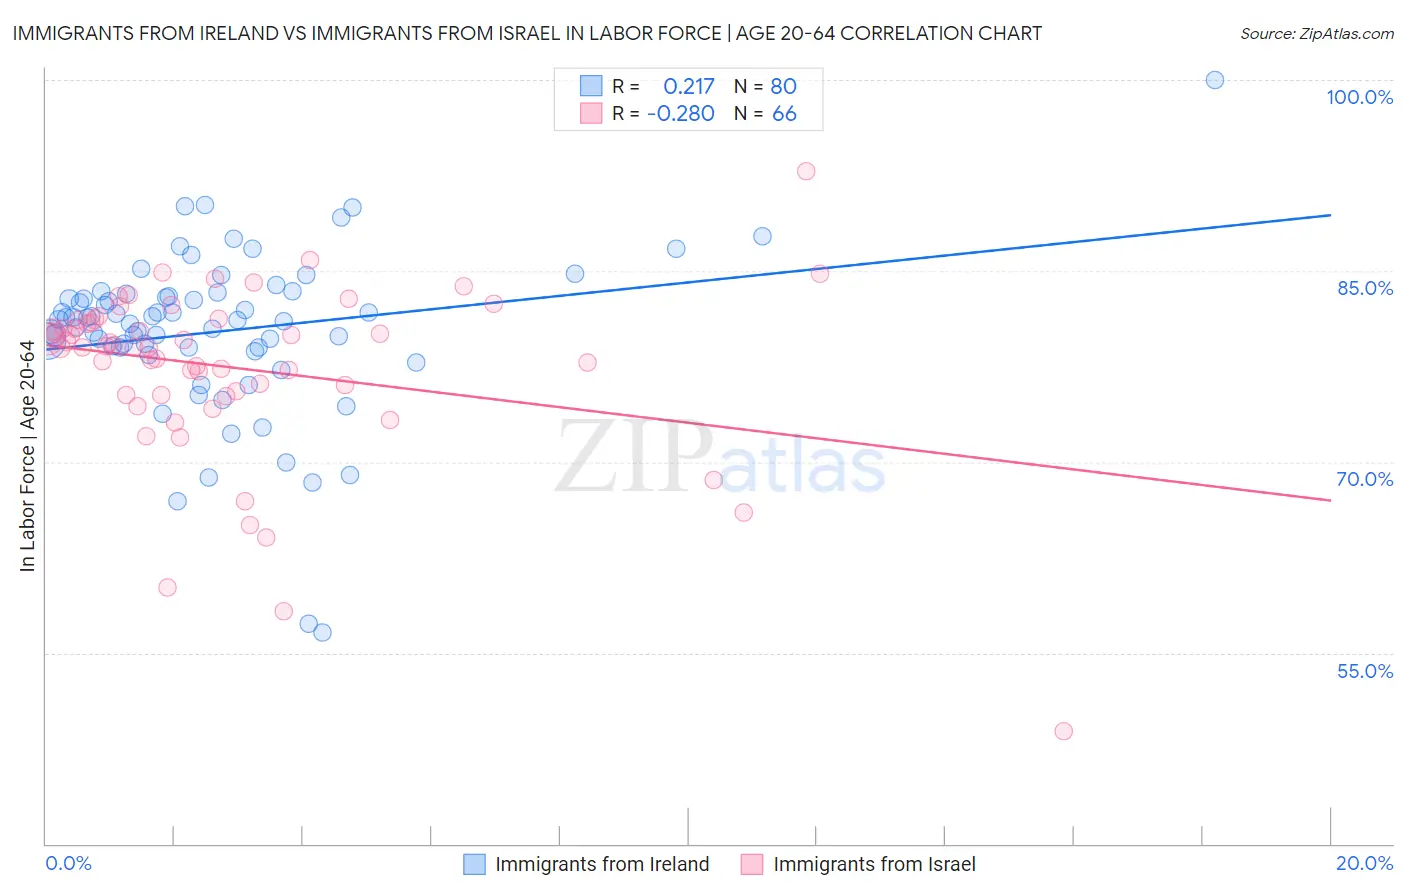
Immigrants from Ireland vs Immigrants from Israel In Labor Force | Age 20-64 Correlation Chart
The statistical analysis conducted on geographies consisting of 240,784,168 people shows a weak positive correlation between the proportion of Immigrants from Ireland and labor force participation rate among population between the ages 20 and 64 in the United States with a correlation coefficient (R) of 0.217 and weighted average of 80.7%. Similarly, the statistical analysis conducted on geographies consisting of 210,029,528 people shows a weak negative correlation between the proportion of Immigrants from Israel and labor force participation rate among population between the ages 20 and 64 in the United States with a correlation coefficient (R) of -0.280 and weighted average of 79.8%, a difference of 1.1%.
In Labor Force | Age 20-64 Correlation Summary
| Measurement | Immigrants from Ireland | Immigrants from Israel |
| Minimum | 56.6% | 48.8% |
| Maximum | 100.0% | 92.8% |
| Range | 43.4% | 44.0% |
| Mean | 80.3% | 77.4% |
| Median | 81.1% | 79.1% |
| Interquartile 25% (IQ1) | 79.0% | 75.3% |
| Interquartile 75% (IQ3) | 83.1% | 81.2% |
| Interquartile Range (IQR) | 4.1% | 5.9% |
| Standard Deviation (Sample) | 6.5% | 7.0% |
| Standard Deviation (Population) | 6.4% | 6.9% |
Similar Demographics by In Labor Force | Age 20-64
Demographics Similar to Immigrants from Ireland by In Labor Force | Age 20-64
In terms of in labor force | age 20-64, the demographic groups most similar to Immigrants from Ireland are Immigrants from Lithuania (80.7%, a difference of 0.010%), Immigrants from South Central Asia (80.7%, a difference of 0.030%), Immigrants from North Macedonia (80.7%, a difference of 0.030%), Chinese (80.7%, a difference of 0.030%), and Immigrants from Uganda (80.7%, a difference of 0.050%).
| Demographics | Rating | Rank | In Labor Force | Age 20-64 |
| Kenyans | 100.0 /100 | #25 | Exceptional 80.8% |
| Immigrants | Serbia | 100.0 /100 | #26 | Exceptional 80.8% |
| Immigrants | Kenya | 99.9 /100 | #27 | Exceptional 80.7% |
| Immigrants | Uganda | 99.9 /100 | #28 | Exceptional 80.7% |
| Immigrants | South Central Asia | 99.9 /100 | #29 | Exceptional 80.7% |
| Immigrants | North Macedonia | 99.9 /100 | #30 | Exceptional 80.7% |
| Immigrants | Lithuania | 99.9 /100 | #31 | Exceptional 80.7% |
| Immigrants | Ireland | 99.9 /100 | #32 | Exceptional 80.7% |
| Chinese | 99.9 /100 | #33 | Exceptional 80.7% |
| Immigrants | Brazil | 99.9 /100 | #34 | Exceptional 80.7% |
| Immigrants | Poland | 99.9 /100 | #35 | Exceptional 80.6% |
| Paraguayans | 99.8 /100 | #36 | Exceptional 80.6% |
| Immigrants | Moldova | 99.8 /100 | #37 | Exceptional 80.6% |
| Ugandans | 99.8 /100 | #38 | Exceptional 80.6% |
| Brazilians | 99.8 /100 | #39 | Exceptional 80.5% |
Demographics Similar to Immigrants from Israel by In Labor Force | Age 20-64
In terms of in labor force | age 20-64, the demographic groups most similar to Immigrants from Israel are Immigrants from South Eastern Asia (79.8%, a difference of 0.0%), Slovak (79.8%, a difference of 0.0%), Immigrants from Sweden (79.8%, a difference of 0.0%), Korean (79.8%, a difference of 0.0%), and Pakistani (79.8%, a difference of 0.010%).
| Demographics | Rating | Rank | In Labor Force | Age 20-64 |
| Belgians | 87.4 /100 | #134 | Excellent 79.9% |
| Ukrainians | 86.8 /100 | #135 | Excellent 79.9% |
| Immigrants | Singapore | 86.7 /100 | #136 | Excellent 79.9% |
| Immigrants | Ukraine | 86.5 /100 | #137 | Excellent 79.9% |
| Immigrants | Nigeria | 86.4 /100 | #138 | Excellent 79.9% |
| Immigrants | Spain | 83.9 /100 | #139 | Excellent 79.8% |
| Immigrants | South Eastern Asia | 80.4 /100 | #140 | Excellent 79.8% |
| Immigrants | Israel | 80.0 /100 | #141 | Good 79.8% |
| Slovaks | 79.9 /100 | #142 | Good 79.8% |
| Immigrants | Sweden | 79.7 /100 | #143 | Good 79.8% |
| Koreans | 79.6 /100 | #144 | Good 79.8% |
| Pakistanis | 79.3 /100 | #145 | Good 79.8% |
| Immigrants | Southern Europe | 78.9 /100 | #146 | Good 79.8% |
| Immigrants | Philippines | 78.0 /100 | #147 | Good 79.8% |
| Romanians | 77.6 /100 | #148 | Good 79.8% |