Pakistani vs Immigrants from Israel In Labor Force | Age 20-64
COMPARE
Pakistani
Immigrants from Israel
In Labor Force | Age 20-64
In Labor Force | Age 20-64 Comparison
Pakistanis
Immigrants from Israel
79.8%
IN LABOR FORCE | AGE 20-64
79.3/ 100
METRIC RATING
145th/ 347
METRIC RANK
79.8%
IN LABOR FORCE | AGE 20-64
80.0/ 100
METRIC RATING
141st/ 347
METRIC RANK
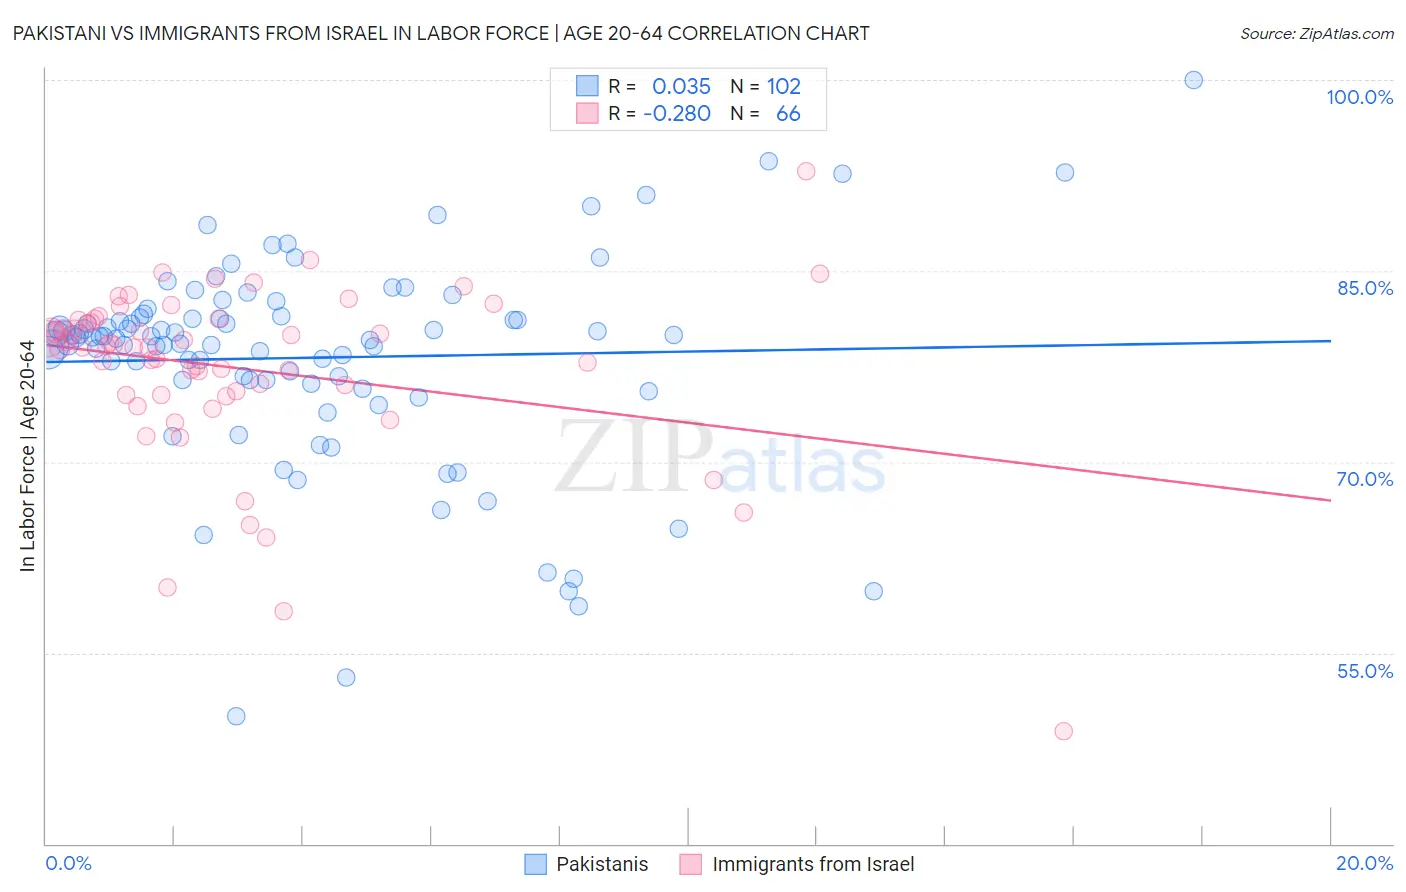
Pakistani vs Immigrants from Israel In Labor Force | Age 20-64 Correlation Chart
The statistical analysis conducted on geographies consisting of 335,365,372 people shows no correlation between the proportion of Pakistanis and labor force participation rate among population between the ages 20 and 64 in the United States with a correlation coefficient (R) of 0.035 and weighted average of 79.8%. Similarly, the statistical analysis conducted on geographies consisting of 210,029,528 people shows a weak negative correlation between the proportion of Immigrants from Israel and labor force participation rate among population between the ages 20 and 64 in the United States with a correlation coefficient (R) of -0.280 and weighted average of 79.8%, a difference of 0.010%.
In Labor Force | Age 20-64 Correlation Summary
| Measurement | Pakistani | Immigrants from Israel |
| Minimum | 50.0% | 48.8% |
| Maximum | 100.0% | 92.8% |
| Range | 50.0% | 44.0% |
| Mean | 78.2% | 77.4% |
| Median | 79.8% | 79.1% |
| Interquartile 25% (IQ1) | 76.4% | 75.3% |
| Interquartile 75% (IQ3) | 81.4% | 81.2% |
| Interquartile Range (IQR) | 5.0% | 5.9% |
| Standard Deviation (Sample) | 8.2% | 7.0% |
| Standard Deviation (Population) | 8.1% | 6.9% |
Demographics Similar to Pakistanis and Immigrants from Israel by In Labor Force | Age 20-64
In terms of in labor force | age 20-64, the demographic groups most similar to Pakistanis are Korean (79.8%, a difference of 0.0%), Immigrants from Southern Europe (79.8%, a difference of 0.0%), Immigrants from South Eastern Asia (79.8%, a difference of 0.010%), Slovak (79.8%, a difference of 0.010%), and Immigrants from Sweden (79.8%, a difference of 0.010%). Similarly, the demographic groups most similar to Immigrants from Israel are Immigrants from South Eastern Asia (79.8%, a difference of 0.0%), Slovak (79.8%, a difference of 0.0%), Immigrants from Sweden (79.8%, a difference of 0.0%), Korean (79.8%, a difference of 0.0%), and Immigrants from Southern Europe (79.8%, a difference of 0.010%).
| Demographics | Rating | Rank | In Labor Force | Age 20-64 |
| South American Indians | 87.6 /100 | #133 | Excellent 79.9% |
| Belgians | 87.4 /100 | #134 | Excellent 79.9% |
| Ukrainians | 86.8 /100 | #135 | Excellent 79.9% |
| Immigrants | Singapore | 86.7 /100 | #136 | Excellent 79.9% |
| Immigrants | Ukraine | 86.5 /100 | #137 | Excellent 79.9% |
| Immigrants | Nigeria | 86.4 /100 | #138 | Excellent 79.9% |
| Immigrants | Spain | 83.9 /100 | #139 | Excellent 79.8% |
| Immigrants | South Eastern Asia | 80.4 /100 | #140 | Excellent 79.8% |
| Immigrants | Israel | 80.0 /100 | #141 | Good 79.8% |
| Slovaks | 79.9 /100 | #142 | Good 79.8% |
| Immigrants | Sweden | 79.7 /100 | #143 | Good 79.8% |
| Koreans | 79.6 /100 | #144 | Good 79.8% |
| Pakistanis | 79.3 /100 | #145 | Good 79.8% |
| Immigrants | Southern Europe | 78.9 /100 | #146 | Good 79.8% |
| Immigrants | Philippines | 78.0 /100 | #147 | Good 79.8% |
| Romanians | 77.6 /100 | #148 | Good 79.8% |
| Icelanders | 75.1 /100 | #149 | Good 79.7% |
| Costa Ricans | 72.4 /100 | #150 | Good 79.7% |
| Scandinavians | 72.0 /100 | #151 | Good 79.7% |
| Immigrants | Northern Europe | 72.0 /100 | #152 | Good 79.7% |
| Immigrants | Kazakhstan | 69.5 /100 | #153 | Good 79.7% |