Burmese vs Immigrants from Israel In Labor Force | Age 20-64
COMPARE
Burmese
Immigrants from Israel
In Labor Force | Age 20-64
In Labor Force | Age 20-64 Comparison
Burmese
Immigrants from Israel
80.3%
IN LABOR FORCE | AGE 20-64
98.8/ 100
METRIC RATING
61st/ 347
METRIC RANK
79.8%
IN LABOR FORCE | AGE 20-64
80.0/ 100
METRIC RATING
141st/ 347
METRIC RANK
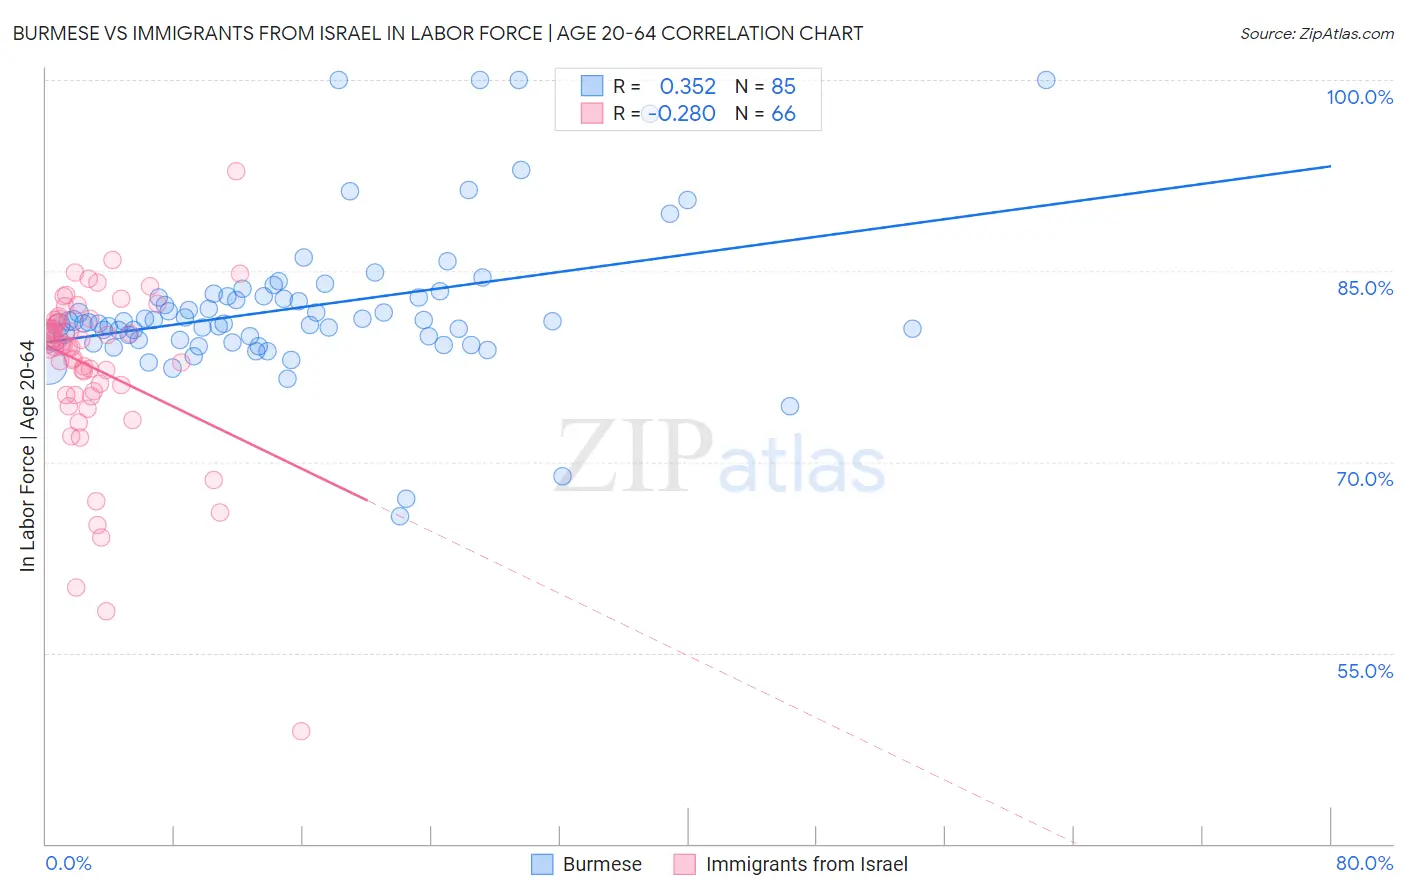
Burmese vs Immigrants from Israel In Labor Force | Age 20-64 Correlation Chart
The statistical analysis conducted on geographies consisting of 465,432,233 people shows a mild positive correlation between the proportion of Burmese and labor force participation rate among population between the ages 20 and 64 in the United States with a correlation coefficient (R) of 0.352 and weighted average of 80.3%. Similarly, the statistical analysis conducted on geographies consisting of 210,029,528 people shows a weak negative correlation between the proportion of Immigrants from Israel and labor force participation rate among population between the ages 20 and 64 in the United States with a correlation coefficient (R) of -0.280 and weighted average of 79.8%, a difference of 0.61%.
In Labor Force | Age 20-64 Correlation Summary
| Measurement | Burmese | Immigrants from Israel |
| Minimum | 65.7% | 48.8% |
| Maximum | 100.0% | 92.8% |
| Range | 34.3% | 44.0% |
| Mean | 82.1% | 77.4% |
| Median | 81.0% | 79.1% |
| Interquartile 25% (IQ1) | 79.5% | 75.3% |
| Interquartile 75% (IQ3) | 83.1% | 81.2% |
| Interquartile Range (IQR) | 3.5% | 5.9% |
| Standard Deviation (Sample) | 6.0% | 7.0% |
| Standard Deviation (Population) | 6.0% | 6.9% |
Similar Demographics by In Labor Force | Age 20-64
Demographics Similar to Burmese by In Labor Force | Age 20-64
In terms of in labor force | age 20-64, the demographic groups most similar to Burmese are Tongan (80.3%, a difference of 0.0%), Carpatho Rusyn (80.3%, a difference of 0.0%), Serbian (80.3%, a difference of 0.010%), Swedish (80.3%, a difference of 0.010%), and Immigrants from Korea (80.3%, a difference of 0.010%).
| Demographics | Rating | Rank | In Labor Force | Age 20-64 |
| Peruvians | 99.1 /100 | #54 | Exceptional 80.3% |
| Immigrants | Cabo Verde | 99.0 /100 | #55 | Exceptional 80.3% |
| Immigrants | Northern Africa | 99.0 /100 | #56 | Exceptional 80.3% |
| Afghans | 98.9 /100 | #57 | Exceptional 80.3% |
| Serbians | 98.9 /100 | #58 | Exceptional 80.3% |
| Swedes | 98.9 /100 | #59 | Exceptional 80.3% |
| Tongans | 98.8 /100 | #60 | Exceptional 80.3% |
| Burmese | 98.8 /100 | #61 | Exceptional 80.3% |
| Carpatho Rusyns | 98.8 /100 | #62 | Exceptional 80.3% |
| Immigrants | Korea | 98.8 /100 | #63 | Exceptional 80.3% |
| Immigrants | Albania | 98.7 /100 | #64 | Exceptional 80.3% |
| Lithuanians | 98.7 /100 | #65 | Exceptional 80.2% |
| Macedonians | 98.7 /100 | #66 | Exceptional 80.2% |
| Taiwanese | 98.6 /100 | #67 | Exceptional 80.2% |
| Bhutanese | 98.6 /100 | #68 | Exceptional 80.2% |
Demographics Similar to Immigrants from Israel by In Labor Force | Age 20-64
In terms of in labor force | age 20-64, the demographic groups most similar to Immigrants from Israel are Immigrants from South Eastern Asia (79.8%, a difference of 0.0%), Slovak (79.8%, a difference of 0.0%), Immigrants from Sweden (79.8%, a difference of 0.0%), Korean (79.8%, a difference of 0.0%), and Pakistani (79.8%, a difference of 0.010%).
| Demographics | Rating | Rank | In Labor Force | Age 20-64 |
| Belgians | 87.4 /100 | #134 | Excellent 79.9% |
| Ukrainians | 86.8 /100 | #135 | Excellent 79.9% |
| Immigrants | Singapore | 86.7 /100 | #136 | Excellent 79.9% |
| Immigrants | Ukraine | 86.5 /100 | #137 | Excellent 79.9% |
| Immigrants | Nigeria | 86.4 /100 | #138 | Excellent 79.9% |
| Immigrants | Spain | 83.9 /100 | #139 | Excellent 79.8% |
| Immigrants | South Eastern Asia | 80.4 /100 | #140 | Excellent 79.8% |
| Immigrants | Israel | 80.0 /100 | #141 | Good 79.8% |
| Slovaks | 79.9 /100 | #142 | Good 79.8% |
| Immigrants | Sweden | 79.7 /100 | #143 | Good 79.8% |
| Koreans | 79.6 /100 | #144 | Good 79.8% |
| Pakistanis | 79.3 /100 | #145 | Good 79.8% |
| Immigrants | Southern Europe | 78.9 /100 | #146 | Good 79.8% |
| Immigrants | Philippines | 78.0 /100 | #147 | Good 79.8% |
| Romanians | 77.6 /100 | #148 | Good 79.8% |