Palestinian vs Dutch West Indian In Labor Force | Age 35-44
COMPARE
Palestinian
Dutch West Indian
In Labor Force | Age 35-44
In Labor Force | Age 35-44 Comparison
Palestinians
Dutch West Indians
84.7%
IN LABOR FORCE | AGE 35-44
89.7/ 100
METRIC RATING
129th/ 347
METRIC RANK
80.4%
IN LABOR FORCE | AGE 35-44
0.0/ 100
METRIC RATING
325th/ 347
METRIC RANK
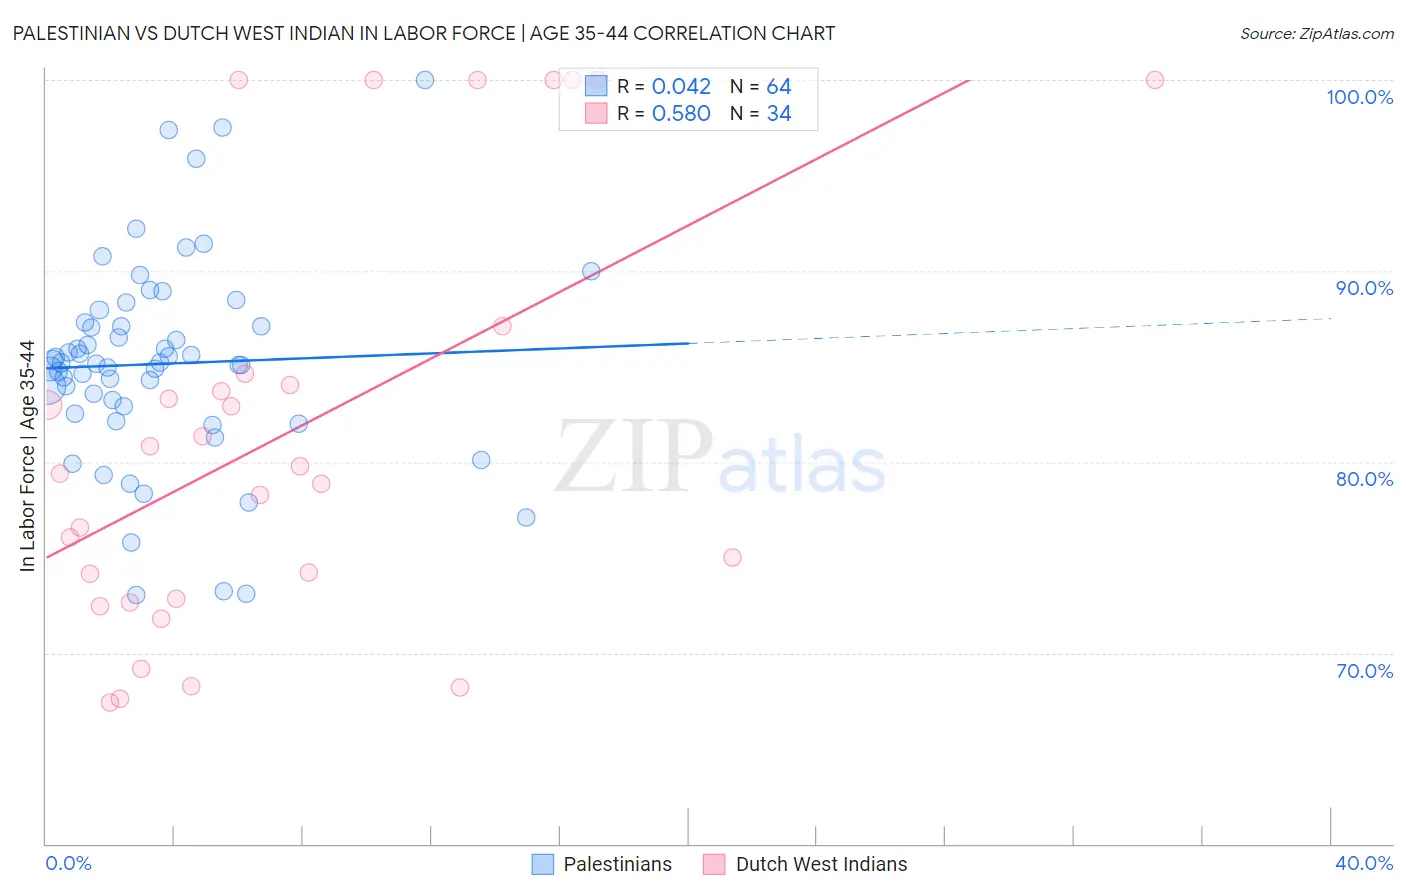
Palestinian vs Dutch West Indian In Labor Force | Age 35-44 Correlation Chart
The statistical analysis conducted on geographies consisting of 216,394,739 people shows no correlation between the proportion of Palestinians and labor force participation rate among population between the ages 35 and 44 in the United States with a correlation coefficient (R) of 0.042 and weighted average of 84.7%. Similarly, the statistical analysis conducted on geographies consisting of 85,765,297 people shows a substantial positive correlation between the proportion of Dutch West Indians and labor force participation rate among population between the ages 35 and 44 in the United States with a correlation coefficient (R) of 0.580 and weighted average of 80.4%, a difference of 5.3%.
In Labor Force | Age 35-44 Correlation Summary
| Measurement | Palestinian | Dutch West Indian |
| Minimum | 73.0% | 67.4% |
| Maximum | 100.0% | 100.0% |
| Range | 27.0% | 32.6% |
| Mean | 85.1% | 81.6% |
| Median | 85.2% | 79.6% |
| Interquartile 25% (IQ1) | 82.7% | 72.8% |
| Interquartile 75% (IQ3) | 87.2% | 84.6% |
| Interquartile Range (IQR) | 4.5% | 11.8% |
| Standard Deviation (Sample) | 5.4% | 10.9% |
| Standard Deviation (Population) | 5.3% | 10.7% |
Similar Demographics by In Labor Force | Age 35-44
Demographics Similar to Palestinians by In Labor Force | Age 35-44
In terms of in labor force | age 35-44, the demographic groups most similar to Palestinians are Bhutanese (84.7%, a difference of 0.0%), Immigrants from Scotland (84.7%, a difference of 0.0%), Austrian (84.7%, a difference of 0.0%), Immigrants from Ghana (84.7%, a difference of 0.010%), and German (84.7%, a difference of 0.020%).
| Demographics | Rating | Rank | In Labor Force | Age 35-44 |
| Germans | 91.0 /100 | #122 | Exceptional 84.7% |
| Immigrants | South America | 90.9 /100 | #123 | Exceptional 84.7% |
| Slavs | 90.8 /100 | #124 | Exceptional 84.7% |
| Maltese | 90.8 /100 | #125 | Exceptional 84.7% |
| Asians | 90.6 /100 | #126 | Exceptional 84.7% |
| Immigrants | Spain | 90.6 /100 | #127 | Exceptional 84.7% |
| Immigrants | Ghana | 90.4 /100 | #128 | Exceptional 84.7% |
| Palestinians | 89.7 /100 | #129 | Excellent 84.7% |
| Bhutanese | 89.7 /100 | #130 | Excellent 84.7% |
| Immigrants | Scotland | 89.6 /100 | #131 | Excellent 84.7% |
| Austrians | 89.4 /100 | #132 | Excellent 84.7% |
| Argentineans | 88.4 /100 | #133 | Excellent 84.6% |
| Immigrants | Korea | 88.2 /100 | #134 | Excellent 84.6% |
| Immigrants | Malaysia | 87.5 /100 | #135 | Excellent 84.6% |
| Afghans | 86.3 /100 | #136 | Excellent 84.6% |
Demographics Similar to Dutch West Indians by In Labor Force | Age 35-44
In terms of in labor force | age 35-44, the demographic groups most similar to Dutch West Indians are Seminole (80.4%, a difference of 0.040%), Choctaw (80.5%, a difference of 0.15%), Yaqui (80.5%, a difference of 0.16%), Sioux (80.2%, a difference of 0.21%), and Paiute (80.6%, a difference of 0.27%).
| Demographics | Rating | Rank | In Labor Force | Age 35-44 |
| Alaskan Athabascans | 0.0 /100 | #318 | Tragic 81.3% |
| Inupiat | 0.0 /100 | #319 | Tragic 80.9% |
| Chickasaw | 0.0 /100 | #320 | Tragic 80.9% |
| Puerto Ricans | 0.0 /100 | #321 | Tragic 80.7% |
| Paiute | 0.0 /100 | #322 | Tragic 80.6% |
| Yaqui | 0.0 /100 | #323 | Tragic 80.5% |
| Choctaw | 0.0 /100 | #324 | Tragic 80.5% |
| Dutch West Indians | 0.0 /100 | #325 | Tragic 80.4% |
| Seminole | 0.0 /100 | #326 | Tragic 80.4% |
| Sioux | 0.0 /100 | #327 | Tragic 80.2% |
| Creek | 0.0 /100 | #328 | Tragic 80.0% |
| Menominee | 0.0 /100 | #329 | Tragic 79.7% |
| Cheyenne | 0.0 /100 | #330 | Tragic 79.5% |
| Houma | 0.0 /100 | #331 | Tragic 79.5% |
| Ute | 0.0 /100 | #332 | Tragic 79.4% |